
For many months our organization had us performing “technical grunt work.” Upon reflection, getting deep into our company’s technological system put us in the unique position of understanding, at a much finer level of detail, the entire assemblage of people, objects, systems, and organizations that make up the world that this technology is becoming a part of. Our paper recounts how we eventually recognized our engagement in technological grunt work as participant observation and how it enabled us to better contribute to decisions about how the technology should work, present itself to users, and be sold. Further, we reflect on an expanded notion of what constitutes the field and fieldwork in corporate ethnography.
INTO THE WEEDS
At eleven on a Tuesday night, we found ourselves hunched over computer screens counting boxes. We were back at the hotel after a hectic day on the floor of a huge yearly retail conference. New York was cold, and the walk back from the Javits Center meant navigating walls of commuter buses making their way from the Lincoln Tunnel to the Port Authority.
The boxes we were counting were generated by a computer vision system developed by our company. They lay over a panoramic image of retail shelves showcasing an array of toothpaste. Each rectangle indicated an instance of toothpaste having been recognized by the algorithm. Grading the recognitions by hand, checking which recognitions were correct and which weren’t, we aimed to understand how well the algorithm was performing and the kinds of problems it was running into. To do this scoring well we had to know the shelf cold, which meant that over time we’d memorized package details, flavors, sizes, and placements. Scoring was grunt work, painstaking and technical, and we were making mistakes, starting over with our chicken scratches more than once.
More concerning, scoring was giving us a very warped perspective on the world. We found ourselves getting excited, cheering, when the algorithm recognized a tricky package, and we were obsessing over why certain products were always in the wrong spot on the shelf. Outside of work, products were like minor celebrities for us, providing a little thrill when we spotted them “in the wild.”
When we were deep in this scoring work, we felt like we were lost in the weeds. We were having a hard time reconciling why we were doing this kind of work, why this work wasn’t being handled by people who are more meticulous, more technically minded. In the depths of scoring, particularly on that night in New York, we felt we’d lost our way. Our team didn’t believe they needed more research on end users or stakeholders. They needed help on testing algorithms and making pictures of products. This work had to get done, and we were available to do it. So we did.
Eventually, however, we found a way back out of those weeds. Soon after that night in New York, we began to realize that what we had learned in scoring enabled us to better contribute to decisions about how the technology should work, how the broader service should be designed, and how the service could be sold. We recognized the value of that foray. Because of having been in deep, we were in the unique position of understanding not only the people who will use the system and engage with the frontend software, but a great deal more, and at a much finer level of detail, about the entire assemblage of people, technologies, and organizations that make up the world that this technology is becoming a part of.
We started to recognize that scoring wasn’t separate from our “real job.” It took the two of us a while to realize that even those weeds should be considered the field and our trudging around in them fieldwork. This paper’s about our trip into and out of those weeds.
THE STORE SHELF
Consumer goods manufacturers spend approximately US$200B a year in the United States. Half of that is spent on advertising across all media channels—commercials, banner ads, etc.—sometimes called “pull” marketing since it’s intended to bring people into stores. The other half is spent on what’s called “trade promotion” or “push” marketing, intended to forefront products once shoppers have made it to a store (or web site) and are considering among a variety of products to purchase. Trade promotion can include things like coupons, store initiatives, special cardboard displays, and prominent placement on store shelves.
Lots of trade promotion money and effort goes into ensuring that the right mix of products is presented in the right array for shoppers at stores. The right mix is, simply, one that will optimize sales for any specific location. Retailers, manufacturers, and distributors collaborate and negotiate to create product assortment lists for each store, and those can be represented in a variety of ways. For many retailers, the final product assortment agreement is formalized in diagrams called (with mid-century marketing flair) plan-o-grams. Planograms lay out, visually, which products should be on a store shelf and which product should be in each position. Once a planogram is designed, the store shelves are configured to the planogram and are kept in this particular configuration, more or less, until a new planogram is created, anywhere from six to eighteen months later.
A combination of workers sets up and maintains the shelves over time. These workers include retail store employees but also manufacturer employees and “retail execution representatives” who are employed by third party sales and marketing agencies on behalf of manufacturers. These employees, also called “merchandisers” or even more commonly “reps,” typically visit a large number of stores in a month across many retailers to make sure their manufacturer’s product is properly stocked and displayed.
In the past, planograms were defined with little variation across a chain’s locations. In recent years, planograms have proliferated with tuning to demographics, store size, and shopper behavior that approaches 1:1 store-level customization. In that environment, it’s unrealistic to expect a rep to keep track of the specific details of every planogram. Instead it’s more common for them to use a broad-brush approach, making sure that the shelf basically looks okay: The manufacturers’ products are clustered, important sub-categories are in a block, value items are on the bottom shelf, and tall and premium products are up top.
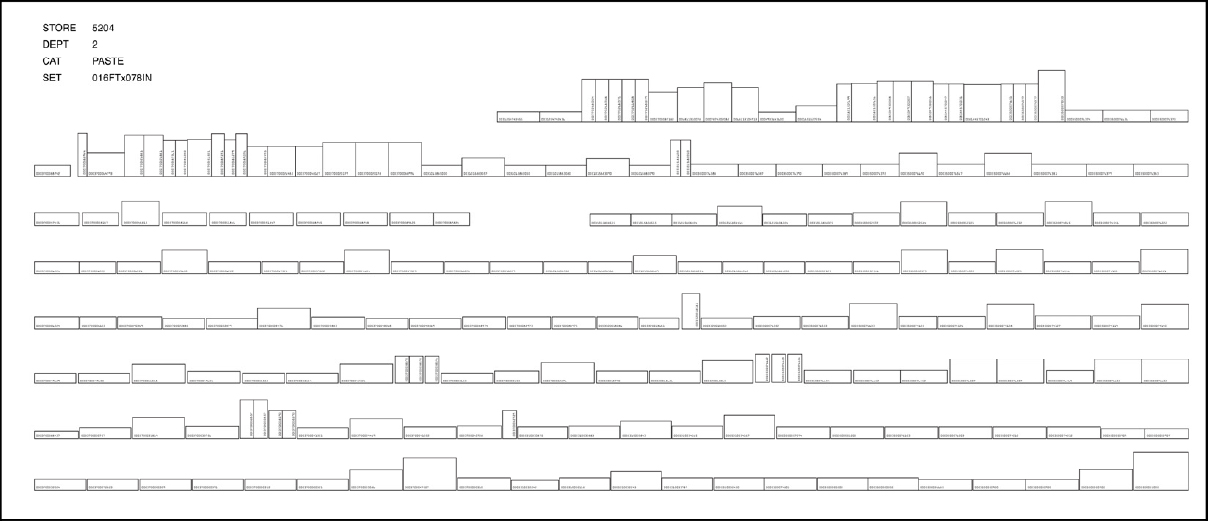
Figure 1. Example of a planogram.
Our company is building a system that is designed to help merchandisers, and ultimately the manufacturers they work for, see and make sense of the shelf in fine detail. Using proprietary computer vision algorithms, the system enables a rep to make pictures of the shelf with a smart phone. The system then assesses which specific products are present on the shelf and which are not and flags problems that the rep can correct in the store. We call these flagged problems “user instructions.” The system can also produce reports that teams at manufacturer’s headquarters can use to monitor store conditions and improve future plans. We call these reports “shelf intelligence.”
FIELDWORK
Before we began the scoring work, we conducted what you might call traditional field research to understand the end users and partner stakeholders who will be engaging with our company’s technology. We did all the normal things—interviews, observations, and secondary research—trying to understand the workflows that have an effect on the shelves and the people who are involved in that work.1 We spent dozens of hours in grocery stores, pharmacies, and big box stores where we observed and talked with workers. We “slung freight” with the night shift, and we trained to do shelf resets. We shadowed merchandisers, and we interviewed store order clerks, reset workers, direct sales and delivery reps, stockers, and auditors. We met with people who work at retailer and manufacturer headquarters including space planners and category managers. We synthesized this research and were able to report with confidence how the complicated world of retail execution works, for example, how planograms are made, how product assortments are chosen, who uses space planning software, and how retail execution agencies work. We could describe the day-to-day jobs—the workflows, tools, priorities, and challenges—of the people who might one day use the service we were building. We understood the workers’ and their managers’ priorities, and the kinds of values each of them brought to their work.
All that field research proved very useful in making sense of the space. In particular, it enabled us to plan the front end of the system being developed by our company. We helped design interfaces for the mobile app, and we helped define how our system connects to the other systems the reps rely on to get their jobs done. It also clarified the kinds of marketing and training that would allow reps and their managers to understand how the system could help them and how to use it. Taken together, what we thought of as typical ethnographic work helped us figure out how the solution interfaced with the human world—how it presents itself and how we explain its purpose and value.
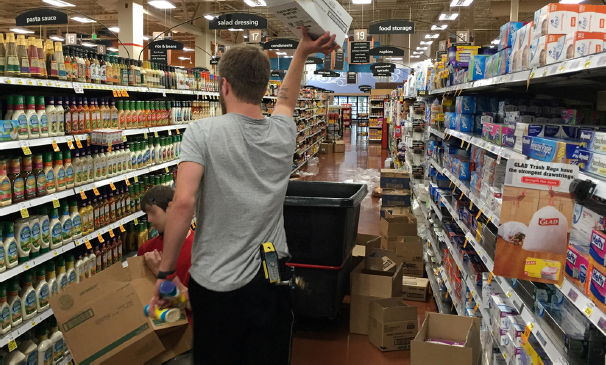
Figure 2. Workers throwing freight.
SCORING
The system we’re working with is sophisticated. Several algorithms and other modules work together to allow raw images to be converted into structured data, and finally into instructions to workers. Calling that large system an “algorithm” or an “app” doesn’t do it justice, but we use those simple terms as handles to make it easier to talk about.
Similarly, when we tried to make sense of the behavior of the algorithm, we used a simplified model to talk about it. We used pseudocode2 in conversations between ourselves, and with technical colleagues, to step through algorithmic processes in plain English. We talked about internal processing at a high level, in terms of data being passed between modules sequentially. We did not trace specific transformations of inputs in real code since we can’t read real code.
In that spirit, we will describe the technical pipeline. First, an optical image is captured with the phone’s built-in camera. The image is encoded as a JPEG, uploaded to our system, and processed using a number of patented and proprietary methods. The images are distilled into structured data including Universal Product Codes (UPCs) and positions, and compared to planograms. Finally, the system outputs instructions to workers like: “This item seems to be missing from the shelf.” While this description of the system is simplified, it is in fact appropriate to conceive of the algorithm as procedural, as a sequence of modules that each process inputs into outputs.
The scoring work that we were engaged in in NYC and over the months before and after was a manual assessment of the performance of each stage of the technical pipeline that made that image-to-data transformation possible. Our evaluation of the system proceeds in the order of the pipeline, because problems at each step can precipitate bigger problems further down the line. These are the main evaluations we did during scoring.
Image capture. The first step is to determine the quality of the images captured by the rep. The images need to cover the entire shelf, with enough overlap and without too much tilting or distortion. Our mobile UI library guides the rep in getting good images, but image capture can be challenging, especially for newer users. Truly bad images are simply unusable.
Recognitions. We judged each recognition—each box on our screen—for whether the system correctly identified the product; we marked each of these as either “correct” or “incorrect.” We also made note of when product on the shelf were totally missed by the system, not recognized at all.
User instructions. Finally, we scored the instructions for fixing the shelf that the system generated and displayed to users. The basic question here is, “Is the system telling the rep about a real problem that needs to be fixed?” User instructions were scored as either good or bad.
Evaluating image capture is a straightforward heuristic assignment. Assessing image recognition and user instructions involves more complicated and time-consuming tasks; it is these tasks that we refer to when we talk about “scoring.”
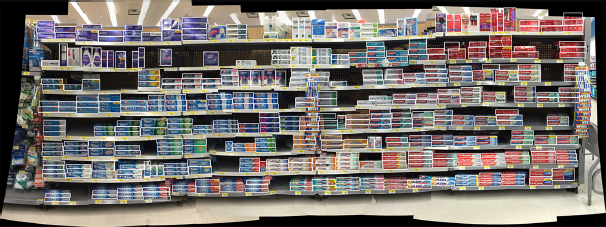
Figure 3. The store shelf. White boxes identify each recognized product.
Interpreting a recognition requires zooming in on a large stitched image, one that may be a bit blurry or contain image processing artifacts. Because products from the same manufacturer tend to look similar (also known as branding), identifying a specific UPC by eye is pretty tricky. For example, every Crest premium product is purplish with dark and light gradient patterns. But is a particular product 4.0-oz or 5.5-oz? If we can confirm the size of its neighbor, we can probably make a good guess. Is the flavor Arctic Fresh or Cool Mint? To answer this question we had to decipher the subtle color difference between the two. Scoring recognitions required iteration, crosschecking, getting second opinions, and a whole lot of squinting. As we became proficient at this detailed scoring work, we developed a great deal of domain expertise. It became a kind of organizational competence, one that we got better at over time.
To score user instructions, we had to first score the true conditions of the shelf by hand. We carefully examined an image of the real-world shelf and compared it, item by item, to the shelf’s planogram to understand which products were actually missing or misplaced. Then, we compared our hand drawn user instructions to what the app generated to determine which aberrations from the planogram our algorithm was catching and which it was missing. In order to understand why misses were made, we examined each false positive and each false negative in relationship to our product recognition scores. We leveraged our understanding of how the technical system worked to understand how the system “saw” the shelf.
Fieldwork at the UPC Level
Because the individual objects on the shelf are the unit of analysis that the algorithm engages with, the scoring work enforced a fine attention to those objects, more than we would have paid otherwise. We found that studying the material culture of the shelf at this level of detail, over time, gave us deeper insight into the lives of shelf workers and what we had learned from talking with them and observing their work. The shelf and all the products on it are inanimate, but they are enlivened by the actions, reactions, and interactions of the people who engage with it. We reflexively interpreted the states of the shelf, the movements and placements of the objects on it, in relationship with our understandings of the people and institutions behind them. We could say, with some certainty, that a Colgate toothpaste sitting in Crest’s territory was the result of a shopper considering, walking, and then discarding the toothpaste in the closest convenient spot. But we could also tell by the location of a clip-strip3 which brand representatives had not been to the store most recently, and we could infer from uneven neatness which brand representative had tidied up their stock that morning. The presence of strange new products signaled that a special display elsewhere in the store had recently been dismantled; these strange newcomers, we knew, were short-lived and rare creatures on the shelf, placed there by the store’s department manager under the pressures to sell it through.
We also compared images made over a period of a month in a single store and examined the subtle and changes on the shelf from one visit to the next. Product packages changed, shelf labels moved. The holes that remained and grew among the Aquafresh toothpaste supported stories we’d heard about a manufacturing issue that had not yet been fixed.
The changing states of objects on the shelf were evidence of the different priorities of workers. A merchandiser who is working for a manufacturer is only concerned that their manufacturer’s shelf space is fully stocked and all of their products are present. The store’s department manager is concerned that any product that needs to be sold through is on display somewhere. Store stockers are concerned that the merchandise they are told to stock has a place on the shelf, even if its placement is an incorrect one. Studying the shelf at this level helped us understand what individual workers are actually doing when they evaluate the shelf, what being “right” really means for them, and which shelf aberrations from the planogram truly matter to them and their bosses. It also revealed a great deal about people and pressures along the path from manufacturer and retailer headquarters, to distribution chains, to in-store operations. As we watched the changes on the shelf over the course of that month, we studied the products’ social lives (Appadurai 1986), and through this, we better understood the people who engage with them and the larger systems that they reside within.
What’s more, we realized that no one else held this particular comprehensive knowledge of the shelf as a whole. Reps know the products of their own manufacturer, but not the other products; department managers know their range of products, but they don’t necessarily know which products aren’t supposed to be on the shelf and which should be on a secondary display; space planners know the planogram, but they don’t know what the real shelf looks like day-to-day as people interact with it. This realization helped us see more clearly how partial the perspective of each of our informants really is. In the real world, no one person or entity controls the shelf. Instead, the state of the shelf at any given time is a fleeting reflection of the complex movements and negotiations of people, corporations, and materials. Our perspective was becoming more similar to that of our company’s technology: We knew what an idealized state of the shelf should be and we could see all the deviations from it. The problem is, our company’s technology assumed that the shelf should always be brought back to that single idealized state and that the humans using the technology should be instructed to reinstate it. In reality, the living shelf is much more complicated and the technology needs to allow room for some of these complications.
Computer Vision and “Seeing”
The input-computation-output architecture that our company’s technology exemplifies was defined by John Von Neumann in 1945 and has since become the standard model in Computer Science, and a computational theory of mind underscores much of Cognitive Science (Chemero 2009). Under such a regime, our system could be conceived as one that corrects inherent human fallibility in computational terms—lack of complete knowledge, lack of motivation, flagging attention, and missed detail.
That’s not how we saw merchandisers make sense of shelf problems. Rather than attempting and failing to meticulously evaluate each product on the shelf, we saw reps triaging a broad range of issues, focusing on 1) making sure displays were up and full, 2) fixing very visible gaps where products were missing, especially prioritizing new and high-value products that move quickly. In other words, we saw reps using information, especially visual information, distributed across their environment and tools, the movement of their bodies, and their memories to identify and then resolve as many problems as they could during their fast-paced visits. Rather than “computing” the shelf, we saw their cognition as embodied (Chemero 2009) as well as situated in their relationships to their organizations and knowledge of the wider retail world.
During field tests where workers tried out the app with us tagging along, the difference between the two approaches became clearer. A couple of examples are informative. In one case, the system flagged a premium product as being missing on the top right side of the shelf. The merchandiser thought the app was wrong; to her eye, everything looked right on the shelf. Only because we’d spent so much time scoring these detailed discrepancies did we know that the system was in fact right, if a little didactic. The product was in fact missing. It had been replaced with a new item that had the same name, description, and packaging, but was half an ounce smaller and, because of its size reduction, had a new UPC. This meant that the planogram—the ideal model of what the shelf should look like—was no longer up to date. Because the change was so trivial, it hadn’t risen to the level of the rep’s attention. In visual terms, the look of the packages, the prices, the product names and locations had all stayed the same. In business terms, products had simply been substituted for one another (resulting in higher margins). No action was required for the human labor system. Better for the logical system to suppress this irrelevant message.
Another example cropped up during this early session that’s worth exploring. The system indicated a mid-range product near the middle of the shelf was missing. Looking at the shelf, the merchandiser could see that there were clearly no gaps, and her instinct again was that the app was wrong. But again, because we had scored this shelf many times, we could stand up for its point of view. In the previous few weeks, someone had removed the shelf label, and added another stack—a “facing”—of its neighboring product, effectively papering over the missing product’s absence. Because there was no visible gap and no label indicating that it was supposed to be there, her expert embodied approach to scanning the shelf for problems missed this situation. In contrast, the computational model, evaluating the shelf one item at a time, was successful. Furthermore, the app was pointing out a significant business problem. Looking back at the series of shelf images we had taken leading up to that date, we learned that the product had been missing for weeks. In a high sales store like the one we were standing in, those lost sales counted. In the store that day, once we explained to the rep what the app was actually seeing she spent the next 20 minutes trying to get the hole fixed.
Experiences like these helped us clarify the specific kinds of problems merchandisers tended to encounter in the course of their work that computer vision can help with. Again, this kind of insight would have been missed if it hadn’t been for the disciplined attention to detail that scoring had enforced.
SCORING FOR IMPACT
Understanding the algorithms and systems through scoring, as a complement to our other field research, put us in a position to make a more meaningful impact on the project than we otherwise would have. In very practical terms, we’ve leveraged that understanding in ways that continue to inform improvements to the technical system throughout the pipeline. Working with the technical team, we’ve contributed to strategies for improving recognitions and shelf detection. We’ve also helped focus the system on the shelf problems that really matter to reps and hide the problems that don’t.
Beyond contributions to technical development, we’ve also been able to support business planning. In the weeks after we began the scoring, we were already making recommendations about further components and services that we knew would be needed to sustain the system over time. We were also able to clarify and articulate the value of the offering for customers. Working with the business development team, we were able to quantify that value more precisely and develop more compelling marketing messages for customers.
Understanding the system more deeply through scoring had another unintended effect: It helped us better understand our technical collaborators. Scoring required us to engage deeply with an expression of their technical worldview. Through this engagement, it became clear that computer vision researchers assume that they’re building a system of logic: a series of inputs (images), models (planograms and classifications), computations (rules and transformations) and outputs (messages) to accomplish the task of analyzing the shelf. By contrast, they didn’t imagine themselves to be building on the existing competence of merchandisers. Once we understood this more completely, we were in a better position to collaborate with our technical colleagues about the system as a whole. Our emphasis with them is now on finding ways to bring a computational approach to bear on the problem in a way that that acknowledges the rich resources merchandisers bring to and leverage in their work, not least of which include the ability to move freely, pick up objects and reach to the back of the shelf, and communicate with store employees. As a result, our business unit is now focused on providing reps with a computational system to complement, and not replace, their existing practices.
REFLECTIONS: A WIDER FIELD
In most traditions within academic cultural anthropology, once you are officially in the field, the field is everywhere you are. That is to say, once you are doing research, every experience and encounter is up for inclusion, e.g., “Now that I was in the field, everything was fieldwork” (Rabinow 1977).
It is also the case that anthropologists and other social scientists are training their attention not only on how people and technology interact, but on things such as “algorithmic life” and how it is imagined and brought into being (see, for example, Helmreich 1998, Seaver 2014).
As ethnographers in a corporate setting, our experience had been somewhat different. Instrumental forces can scope down the field for us to use cases and market segments, which can also lead to narrowly scoped protocols and research activities. This has the effect of circumscribing the field to places outside the office, to times when we capture pictures, video, and audio, jot notes in a notebook, or make mental notes to write up later.
Reflecting on our scoring work, we realized that we had actually been engaging as participant observers all along as we flagged errors, compared product sizes, and learned subtle packing changes. It may have been incidental participant observation, in the sense that we never planned to be conducting fieldwork as such, but we did inhabit this work with inquisitiveness, and we joined in a “practice of correspondence” as we did it (Ingold 2014, 390). Out of this participant observation came, almost inevitably, interpretation, and this unlocked a much better understanding of the entire assemblage (Balsamo 2011) of our company’s technology and the retail world—the algorithm, the people who interact with it, the people inside our office who built it, and the ways these pieces can exist together.
In the end, the value of our having been the people handling this technical grunt work lay in the approach we took.4 Someone with a purely technical perspective may have approached scoring as a narrow task, a numerical summation of accuracy. As we closely assessed the algorithm and the objects it interacts with, we couldn’t help but take an ontological stance of holism and curiosity, and summon a desire to connect pieces to one another, drawing connections between the details of the algorithm and the people and organizations that it intersects with.
Scoring lacked the trappings of fieldwork. We didn’t pull out pens, paper, or cameras and claim, “Now I am in the field!” Instead we went about learning technical systems as members of an organization that needed all hands on deck. We took up tasks that needed doing. But as we reflect on how we engaged in that technical work, we are brought back to a very simple realization: The field is truly defined by our relationship to it and the quality of attention we bring. This simple realization is sticking with us. We had gotten deep into weeds that we somehow didn’t recognize as the field, not until we started to find our way out. As we go forward, we are retaining this expansive understanding of what counts as a field site and as fieldwork when we do research for our organization. We will not lose sight that “when our object of interest is the algorithmic system, ‘cultural’ details are technical details” (Seaver 2014). Collaborators and the technical systems they’re creating are just as much a part of our field research as supermarket loading docks or any other site. We no longer shy away from tasks that appear technical or tedious. In fact, we’re seeking them out. In a technology-focused company like ours, we’ve found there’s value deep in the weeds.
Tiffany Romain is Advisory Research Anthropologist at Ricoh Innovations where she investigates people and technology in healthcare, retail, and workplaces. Before Ricoh she wrote a dissertation on reproductive cryopreservation and cryonics as means for managing life’s beginnings and endings, and the timing of life in the middle. tiffany@ric.ricoh.com
Mike Griffin is Director of User Experience at Ricoh Innovations. He works with a team of anthropologists, designers and engineers to ensure that Ricoh’s new products and services come to market informed by a clear understanding of the worlds they’ll be engaging. mike@ric.ricoh.com
NOTES
All trademarks identified herein are the property of their respective owners.
1. Almost all of the people we talked with have worked in retail in one form or another for most, if not all, of their working lives. Many have shuffled between different roles and jobs, often due to attempts to reduce labor costs, leaving them in more precarious positions (see also Cefkin, Anya, and Moore 2014). This also means that while each job requires a particular perspective and set of priorities, many of these workers understand the perspectives and priorities that are required of other roles.
2. Pseudocode is a term of art in Computer Science, but one we hadn’t encountered until it was introduced to us in conversation in 2011 by our colleague Ron Conescu.
3. A clip-strip is a long piece of plastic that hangs from a metal hook down the face of the shelf. It’s often placed by third party merchandisers and displays merchandise that is unrelated to other products around it. It’s considered a nuisance by most reps, who often shift it in front of competitor products.
4. Ours was not, of course the first instance of field research involving painstaking and somewhat technical grunt work. Rick Robinson and Maria Bezaitis helpfully pointed out that researchers at e-Lab, for instance, tagged video footage in detail, to name just one example.
REFERENCES CITED
Appadurai, Arjun
1986 Introduction: Commodities and the Politics of Value. In The Social Life of Things: Commodities in Cultural Perspective. Arjun Appadurai, ed. Pp. 3–63. Cambridge: Cambridge University Press.
Balsamo, Anne
2011 Designing Culture: The Technological Imagination at Work. Durham: Duke University Press.
Cefkin, Melissa, Obinna Anya, and Robert Moore
2014 A Perfect Storm? Reimagining Work in the Era of the End of the Job. Ethnographic Praxis, 2014: 3–19. doi: 10.1111/1559-8918.01002
Chemero, Anthony
2009 Radical Embodied Cognitive Science. Cambridge: MIT Press.
Helmreich, Stefan
1998 Silicon Second Nature: Culturing Artificial Life in a Digital World. Berkeley: University of California Press.
Ingold, Tim
2014 That’s Enough About Ethnography! HAU: Journal of Ethnographic Theory 4(1): 383-395.
Rabinow, Paul
1977 Reflections on Fieldwork in Morocco. Berkeley: University of California Press.
Seaver, Nick
2014 Knowing Algorithms. Paper presented at Media in Transition 8, Cambridge, MA, 2013, revised 2014.