Over a century after W.E.B. Du Bois developed the concept of double consciousness, this experience of “twoness”...


Over a century after W.E.B. Du Bois developed the concept of double consciousness, this experience of “twoness”...

This tutorial is a crash-course in one of the most powerful research and storytelling tools—the visual framework....

Graphic ethnography is on the rise! In a brief introduction we will explore how anthropological research has been...
Smart devices and online research platforms are changing the landscape of qualitative data collection and analysis. While data collection mechanisms have flourished, analytic tools to work with that data have not meaningfully evolved. Changes in professional practice and advances in technology are...
In her presentation to EPIC, Kimbell reflects on how data are visualized and how they are experienced. Drawing on work in the visual arts and design, she considers what practices that seem to be gathering and visualising data are actually doing, from installations such as her project...

PART I: AN EXPLOSION OF VOICES, BUT LITTLE SENSE-MAKING With the rise of social networking sites like MySpace and Facebook, as well as YouTube, and the popularity of blogs, there has been no other time where so many voices are being heard on so many topics. Personal blogs, many of which contain...
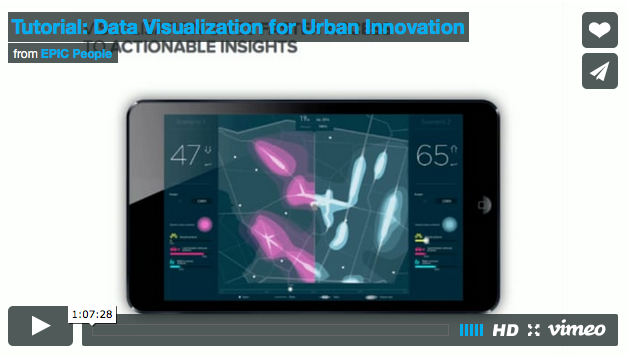
Instructor: Visualizations are powerful research and communication tools, revealing questions we didn't even know to ask and allowing faster access to...