
This case study explores how we personalized search results by turning ethnographic insights into taxonomic metadata, which in turn allowed us to use quantitative methods to assess business impact. The first part of the case study focuses on the problem we were trying to solve – creating better search results for nurses – and using ethnographic interviews to understand how nurses approached looking for jobs. The second part of the study dives more deeply into how metadata works, and why it was the perfect partner for capturing our ethnographic findings and making them into a scalable and measurable part of the design process. The third part of the study details how we tested and scaled our designs in the live project, and why we believe others might benefit from using a similar approach. Keywords: mental models, taxonomy, business impact.
INTRODUCTION
While researchers understand how valuable ethnographic research is for defining a problem space – particularly in the early stages of product development – it can sometimes be difficult to justify the time and cost of this method to employers and stakeholders. All too frequently, companies focus on “quick wins” using remote usability testing or A/B testing, the better to show impact with quantitative metrics. Furthermore, it can be challenging to articulate the value of discovery research within this environment, particularly because the perceived value of the research often ends with the report. Given this setup, it is difficult to trace a direct line of impact between ethnographic research and large-scale, measurable results.
In this case study, we show how combining both qualitative and quantitative approaches – specifically, ethnographic research, taxonomic metadata classification, and product analysis – can measurably improve search engine results. We begin by describing the ethnographic research that allowed us to understand how nurses searched for jobs. We then detail how we used taxonomic metadata as a vehicle for our findings, as well as describing the value of metadata for scaling the project. We outline how metadata is a tool for disseminating users’ mental models throughout the site; how it can inform both back-end (algorithmic) and front-end (user interface) design; and how, once the metadata was in place, we were able to repeat the process with other segments beyond nursing and in markets outside the U.S. Finally, we will demonstrate how this approach addressed the aforementioned challenges in measuring the impact of ethnographic research, and allowed us to draw a direct line from our initial discovery interviews through to the A/B testing of the final design.
By sharing our process and outcomes, we hope that this case study will help other ethnographic researchers find ways to think about measuring the impact of qualitative research, as well as strategies for scaling the results of qualitative insights.
BACKGROUND
Indeed.com is a global job search website that receives over 250,000,000 visitors every month.1 The core functionality of the site is the search engine: employers post jobs, and job seekers look for them. As researchers, designers, and taxonomists, our goal is to provide the best search experience possible, and to strive for continuous improvement. In 2018, one major area slated for improvement came from the realization that, at its inception, our site had been designed for an “average” job seeker and that – based on many teams’ research – there likely wasn’t an “average” job seeker, but rather, different segments of job seekers with different wants and needs.
With the goal of more personalized search results on our minds, both the User Experience (UX) and Taxonomy teams were trying to facilitate cross-team work. One organizational challenge was a presumed separation of interests: UX was tasked with designing the front-facing user interface while teams such as Taxonomy were tasked with the designing the back-end of the site – meaning the algorithms and the metadata that power the search – without having established avenues to test the potential front-end design impact of their work.
In 2018 the Taxonomy team had created an extensive metadata system for classifying jobs in Occupation categories. In layman’s terms, Occupations are groups of jobs with similar duties or responsibilities, such as nurses or truck drivers. The design team knew that this data could be used to make design decisions, and the Taxonomy team understood the value of getting user feedback on their work. It was an opportune time, then, for the creation of a new, cross-functional team that aimed to bring together both qualitative and quantitative analysis to ensure the best user experience for specific segments of customers, while also tracking business impact. The team was called “Segmentation” and its overarching goal was to examine and improve our business results for certain segments of job seekers. A segment could be defined in many ways: it could be a category (such as people who work from home); an industry vertical (such as government work); an occupation (such as lawyers or truck drivers); or a behavior (stay-at-home caregivers). Regardless of classification, the team’s director believed strongly in the need for ethnographic research as a key tool for understanding our users.
RESEARCH GOALS
Based on market research, the first customer segment identified for our project was nursing. We already knew that our nursing job listings were not performing as expected, and according to the Bureau of Labor Statistics, the market for nursing jobs was only projected to grow (U.S. Department of Labor 2020). And so, starting the segmentation project in August of 2018, we wanted a deep, foundational understanding of what job searching looked like for nurses. As the project progressed, our objective became more focused: based on what we’d heard, we needed to ensure that the search engine accurately reflected the mental models of our nursing job seekers; to do this we needed to iterate and validate both taxonomy choices and user interface designs that surfaced new metadata for feedback. In the final phase, we had to find ways to measure the effect of these design and taxonomy decisions by running in-product tests to show business impact.
METHODOLOGIES AND PROJECT STRUCTURE
In the course of the project, we used several methodologies, ranging from ethnography and card sorting to data analytics and A/B testing. For this reason, it is easiest to walk chronologically through the project, examining each method as we go.
Taxonomy-Informed Ethnographic Interviews
In order to collect user feedback from nurses, we needed to find the right participants for the interviews. The Taxonomy team had definitions in place for who was or was not a nurse and had recently created search facets specific to nurses, such as licensing credentials. We based the interview screening process on the existing criteria and filtered out potential participants that didn’t fit the study profile. For example, we ruled out Physician Assistants, Surgical Technicians, and Phlebotomists, but included Registered Nurses, Licensed Practical Nurses, Licensed Vocational Nurses, Nurse Practitioners, as well as Nurse Assistants and Aides. We then interviewed fifteen nurses, using a semi-structured approach that allowed us to ask about job search habits, desired jobs, and other areas of inquiry.
From our ethnographic research, we found that nurses, too, had formed opinions about nursing as a job category. As one nurse told us, “I think that there are certain things that shouldn’t even be in this category. If I’m searching for an RN [registered nurse] job, medication aide doesn’t need to be there, or nursing assistant, or home health aide. A nurse assistant aide is not going to look for an RN job. To be honest, that’s a little offensive.” This information bolstered our suspicions that we were on the right track with trying to categorize jobs in a more refined manner.
When it came to searching for jobs, we also found that nurses had a great deal of information at their disposal. Due to their deep professional networks, they usually understood the options for employment in a given locale, and also had a good idea of how well local employers paid. Additionally, experienced nurses had options, and therefore strong preferences, about how and where they worked. One nurse saw a strong correlation between the appeal of different types of nursing jobs and specific personality types: “The Emergency Department can be kind of blunt: very concise, quick, not super in depth – Type B nurses. ICU [Intensive Care Unit] nurses are the flipside. They are very intensive with their care. They are very Type A. Medical Surgical is the ‘dark and stormy place’ of nursing. Most people don’t necessarily want to work Med Surg, but it’s known as a good place to start out.”
Because experienced nurses had very specific requirements, they were frustrated that the search interface, including the job descriptions themselves, did not include information addressing these preferences. They wanted more information about the working environment (including equipment), what types of patients they would be working with, and detailed information about shifts; unlike typical office jobs, nursing can include anything from four- to twelve-hour shifts. Finally, they needed information on which medical specialties were expected in a given job. Overall, our analysis revealed what Indi Young calls mental models (Young 2008). In our case, the nurses’ mental models were the preferences and information needs underlying their decision-making process. As Young notes, identifying mismatches between your product and customer expectations can provide opportunities for designing better solutions. Based on our interviews, we had identified clear gaps in our product; the challenge was to address these gaps within the framework of a mature and complex search engine. We could not rely on our generative research being integrated into initial product development, nor was it feasible to add surface-level features on top of the existing product. Furthermore, an individual job description was unlikely to provide the information nurses wanted. For these reasons, we began to think about how to leverage metadata to solve our problem.
Method in Detail: Metadata as Vehicle
Before talking about the next step of the project, it may be beneficial to talk more generally about the role of taxonomic metadata in search-based products. One example is the system an e-commerce site uses to classify its items. A shoe site might classify shoes using categories such as boots, slippers, types of heel, or color. Similarly, a clothing site might use descriptive taxonomy categories such as “billowy” or “bohemian” (McDowell 2020).
All of these descriptive items are taxonomic metadata. The data may have been created manually by humans, just as one might apply category or tag labels to articles in a content management system; they may also be created by running items through various types of automated analysis algorithms; finally, and as we will discuss below, taxonomic metadata is often the result of combining manual classification with automated analysis. Importantly, while a site’s user interface features (such as filters) may expose the taxonomic metadata directly to users, the metadata can also exist as an invisible support system that helps turn user queries into search results – a function most often associated with query understanding. Any type of metadata can be made visible or invisible to the end user, depending on how a given platform chooses to display it (Gartner 2020; Harvard Law School 2020).
Indeed uses a search engine just as an e-commerce site does, but instead of searching for clothing items, our users are looking for jobs. The content of Indeed’s search engine is made up of documents related to job searches; here specifically we will focus on job posting documents which employers create and upload, either to our site or other online locations. The job documents are then indexed by Indeed’s search engine, allowing job seekers to find them using search queries. When employers post jobs, they may not explicitly include all information the job seeker wants. For example, they may post a job with the heading “Project Manager,” a title which lacks relevant industry context: this job could exist in areas as diverse as construction, electrical work, or software engineering. By analyzing job titles in conjunction with information contained in job descriptions, the Taxonomy team can create relevant Occupation categorizations, and add this metadata to the job document.
Once the metadata is added, it can remain hidden from view, and be used as a factor in ranking search results – this is what we might call a “back-end” use. Alternatively, its presence can be made visible with design choices on the front end, such as filters. The value of metadata, then, is that rather than being a single feature, it has the potential to power many different features. It was in this context that we began to think seriously about how to translate the findings from our ethnographic discovery research into metadata usable by the search engine, and by extension, able to be disseminated into the site at large.
Combining Design and Analysis for User-Informed Taxonomy Development
As of 2018, Indeed’s Taxonomy team had done extensive work on developing its own metadata classification schemas, including a home-grown Occupation taxonomy. It is important to note that while there are existing third-party categorizations of jobs by industry and occupation, like the Bureau of Labor Statistics (BLS), they do not update categories regularly; it might well be a decade between updates. For this reason, the BLS does not reflect the quickly changing nature of jobs in the modern world, and also falls behind on linguistic trends (e.g. the switch from “Library Science” to “Information Science”). Because Indeed’s core content is centered on what job seekers want, the Taxonomy team must be able to move in a more agile fashion, and address search queries happening in the moment. A recent example of this need was the advent of COVID-19; based on the work we are describing here, Indeed’s teams were able to incorporate this data into medical job listings quickly. Last but not least, our Taxonomies are created with a global audience in mind.
In order to create taxonomic metadata, the Indeed Taxonomy team uses a variety of techniques, from external research and qualitative studies (e.g. card sort), to quantitative analysis of internal data and text mining. Creating the classification schemas, however, is only one aspect of metadata at Indeed. We also need to extract the metadata concepts we define from unstructured text, like jobs and resumes, so they become available throughout our infrastructure and can be used in a variety of search products and algorithms. We do this via a combination of natural language processing (NLP) tools and human curation.
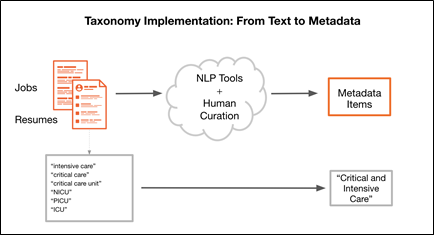
Figure 1: Flowchart showing how the Taxonomy team maps text to metadata.
In short, the taxonomic metadata captures information that job seekers expect to be relevant – that is to say, it expresses something of their mental model in ways that the original document might not. In this way, metadata can improve the search engine’s performance so that users find the best results and the employers find the best candidates. Ultimately, our metadata helps bridge the gap between what users intend when they type something in the search box, and what the site returns to them.
For this reason, the Taxonomy team had already considered using medical specialty metadata as a search facet for healthcare Occupations, as early as 2017. But given product development tradeoffs, the team had to prioritize other work. The ethnographic research with nurses provided a crucial opportunity to revisit that priority. The interviews revealed just how important the information was to nurses, which suggested that it might also be important for other medical job seekers. Additionally, the Segmentation team’s market research suggested that it was an opportune time to move medical taxonomy work from the back burner to the top priorities list. Given the opportunity to work more on medical specialties, the Taxonomy team had to make the choice between adopting existing taxonomies of medical specialties, like the one created by the American Board of Medical Specialties, and building a new taxonomy that would fit our job seekers’ needs and the data trends on our site. The Taxonomy team also had to make internal decisions on whether they wanted separate taxonomies for medical specialties and medical departments, as opposed to merging them into one category, and on whether medical specialties should be specific to nurses or cover all health care professions. And in order to get answers to these questions, the team needed to surface the taxonomy categories directly to users via the front-end design. In short, the ethnographic research created another opportunity: a chance to expand on the existing taxonomies in a user-informed fashion.
Design Testing and Iterating on Taxonomies
In January 2019 we began our first design tests, in which we tried surfacing skills metadata as a filter in a design concept (as illustrated below).
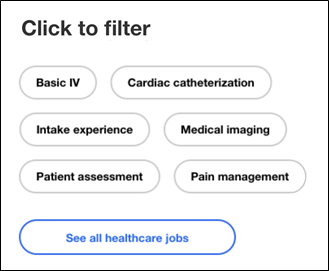
Figure 2: Design for the initial concept test offering skills-based filters such as “patient assessment” and “Basic IV.”
Our research sessions revealed that filters were a successful approach, but our first attempt at surfacing data didn’t quite hit the mark. As one nurse noted: “I guess I’m a little confused about the ‘Basic IV’ because that’s required by all nurses. So I think that’s kind of redundant.” As non-experts, we had made the wrong call about which pieces of data it was important to display, and it was crucial to understand that early on. And since the Taxonomy team was working on medical specialties in parall el, this feedback helped them decide what the final taxonomy categories were going to look like.
As work progressed in 2019, the Taxonomy team was able to quickly update and refine categories to ensure they fit our users’ mental models by closely collaborating with Segmentation and UX Research. Unlike the skill-based filters we’d started with, the medical specialty filters (for example “medical imaging” or “cardiac catheterization”) performed well in our initial design testing.
In-Product Testing and Agile Taxonomy Feedback
Having already done small-scale design testing with the filters, we were ready to expand our testing to in-product analysis. In the third quarter of 2019, the Segment Manager launched an A/B test using the ethnography- and taxonomy-informed filters we had been designing. A/B testing allows a site to show two different versions of a user interface to two different sets of users; logs of user behavior are used to identify which group (A or B) performs best, according to the metrics that have been chosen. As mentioned earlier, Indeed has a large number of users so we can run A/B tests quickly and easily identify statistically significant results. Based on the user behavior, the product stakeholders decide whether to modify the product based on new designs or to maintain its current status.
In this case, we looked at analytics to identify the top nursing related queries and targeted these users for the A/B test. 50% of the users (the control group) experienced the normal interface on Indeed, and 50% were in the test group, where they saw the medical specialty filters. In the first study, our test group added three filters to the site: Specialty, License, and Patient Type.
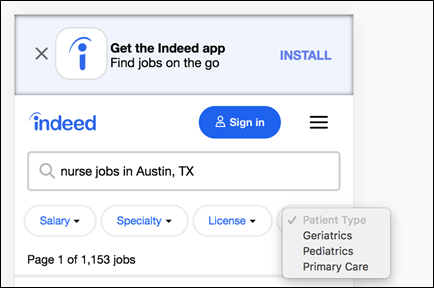
Figure 3: Design for the A/B test of nursing metadata, using mobile filters created by ethnographic research combined with taxonomic analysis.
For the Patient Type filter, we started with three categories: pediatrics, geriatrics, and primary care; note that these categories and options were prioritized based on what we’d heard speaking to nurses in our ethnographic interviews.
Unfortunately, this filter did not perform well in initial tests. After further investigation and discussions we decided that what we’d initially thought of as “patient type” fit better under the “medical specialty” data category. With further testing, we narrowed the design and taxonomy combination down to two filters, Specialty and License.
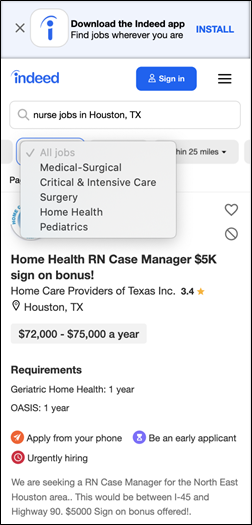
Figure 4: A finalized version of the mobile filter, which combined license and medical specialty.
Even after narrowing down the data itself based on A/B testing, the Taxonomy team ran further card sort studies to improve filter display names. The goal was to identify names of specialties that were familiar but also distinct enough: for example, to decide whether “OR” (Operating Room) was a better label than “Surgery.” There was also a need to test the boundaries of conceptual overlap, and to find out how similar or dissimilar “medical-surgical” and “surgery” were for nurses.
MEASURING AND SCALING THE RESULTS
Based on the A/B tests, the Segment Manager was able to produce a quantitative analysis of the results. Indeed uses multiple proprietary internal tools to measure A/B tests, and they include a homegrown version of Structured Query Language (SQL) which allows us to pull mass amounts of data from our databases. The Segment Manager created queries to see which filters were used most often, which were underutilized, and which resulted in an application to a job.
After monitoring weeks of data from thousands of users, overall filter usage increased and we also saw an increase in positive outcome metrics. These results aligned with the team’s KPI for the quarter (although we cannot share details for legal reasons). Thus, by addressing the issues nurses reported in our initial ethnographic interviews, and supporting those needs via taxonomic data, we could show clear, positive business results.
Later, having seen success with the medical specialty and license filters, Segmentation decided to perform another A/B test using a “shift” filter. Taxonomy teams had been building these attributes because during the ethnographic interviews, the nurses had identified scheduling as a major pain point that influenced their decision to apply to jobs. Attributes included filter options such as shift length, time of day, and hourly.
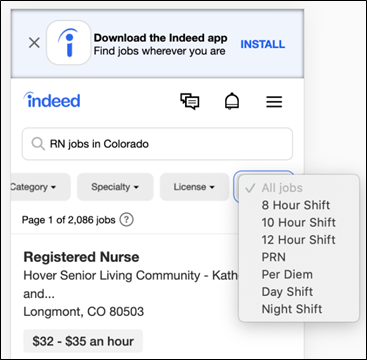
Figure 5: The nursing “shift” mobile filter, which displays multiple options to job seekers to account for their unique needs.
What happened next was interesting. After reviewing the results of the shift filter test there were no statistically significant changes in desired metrics. In the past, without any meaningful change, a team would turn off a test and deem it unsuccessful. Yet, rather than dismissing the data, Segmentation decided to create a new process. If results were neutral (or trending positive), they would roll out the changes in production. The logic behind this change was that customization is valuable in and of itself; both psychological (Devaney 2017) and ethnographic insights combined to tell us that customization and additional information was valuable. Job seekers want to feel that their unique needs are being heard and addressed, and therefore, a design that shows net neutral A/B metrics is still worthwhile as a way to personalize the site for them.
Furthermore, once disseminated throughout the site, the metadata continued to be used in designing experiences; as Figure 6 shows, the data is now included regularly on the job description.
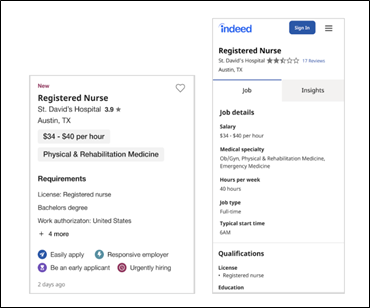
Figure 6: The “job card,” which is a job description that displays structured data. In this case, the nursing metadata created by our analyses became a regular part of the job description display.
In this way, starting from our ethnographic understanding of how nurses make job decisions, we moved to large-scale implementation of the necessary information using taxonomy metadata as a vehicle. And this was only the first segment that we pursued; starting in 2018, we expanded the same approach to other segments such as trucking and retail. We now had a rough idea of how best to pursue the journey from initial discovery work to in-product testing, and were able to streamline the process.
Today, we continue to scale our work domestically and abroad. For instance, what started as four medical specialties is now fifty-seven medical specialty attributes in the USA. Shifts and schedule attributes now exist in approximately twenty-seven markets and requests are coming in regularly to expand our taxonomy to reflect international needs. By the time of publication additional attributes will have been created and may even be visible on our site.
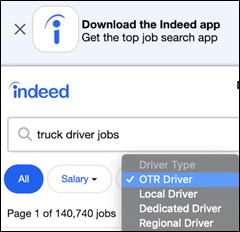
Figure 7: Trucking mobile filter for job type, using structured data generated by the same ethnographically-driven process as we used for nursing.
Working together across teams, we were able to combine qualitative and quantitative analyses in ways that benefitted both our internal and external users. By having ethnography inform taxonomy categories, and vice versa, we were able to create metadata that informs both the front-end and back-end of product development, and ultimately ensures that ethnographic research makes its way into the front-end and the back-end of the site.
Amanda Krauss, Ph.D. is a Senior Design Researcher at Duo Security (now a part of Cisco), and was previously a Senior UX Researcher at Indeed. She has been doing mixed-methods research for over 20 years, and has worked in digital media, academia, and consumer-facing product development. akrauss@duo.com
Alexandra Teodorescu, Ph.D. is a Taxonomy Analyst at Indeed where she develops metadata structures and ways to extract information from text. Before Indeed she taught and conducted research into Linguistics and Cognitive Science at The University of Texas at Austin, Princeton University, and McGill University. ateodorescu@indeed.com
Leora Yardenay, M.Ed. is a Segment Manager at Indeed, where she conducts qualitative research and product analyses. After graduating from Tulane University, she served with AmeriCorps and pursued a Master’s in Education from The University of Texas at Austin. She then pivoted to tech and currently works at Indeed, the employment-related search engine. leora@indeed.com
NOTES
The authors would like to acknowledge the foundational work of Emily Bulger, the former Taxonomy Director at Indeed, who established the overall direction and vision for Indeed’s taxonomy, and the cross-functional foresight of Jan Schreur, who oversaw the formation of the Segmentation Team. We would also like to thank Andrew Childress, Matthew Clark, Ketan Gangatirkar, Wes Hall, Valle Hansen, Shannon Hildenbrand, Tatjana Hocke-Mirzashvili, Michael Kucker, Arjen Postma, Ron Richardson, Marianna Symeonides, Alice Wallace, Emma Whittington, Dave Yeats, and Michelle Zhou for giving us feedback on earlier versions of this paper.
1. This figure represents the number of unique visitors to the site according to an internal Google Analytics report run in September of 2018.
REFERENCES CITED
U.S. Department of Labor, Bureau of Labor Statistics. 2020. Occupational Outlook Handbook. Registered Nurses. Accessed August 21, 2020. https://www.bls.gov/ooh/healthcare/registered-nurses.htm
Gartner. 2020. “Gartner Glossary” s.v. metadata. Accessed August 21, 2020. https://www.gartner.com/en/information-technology/glossary/metadata
Harvard Law School. 2020. “What is Metadata?” Harvard Law School website. Accessed August 21, 2020. https://hls.harvard.edu/dept/its/what-is-metadata/
McDowell, Maghan. 2020. “Taxonomy is the New Fashion Tech Essential.” Vogue Business website. July 28. Accessed August 14, 2020. https://www.voguebusiness.com/technology/taxonomy-is-the-new-fashion-tech-essential-the-yes
Devaney, Erik. 2017. “The Psychology of Personalization: Why We Crave Customized Experiences.” Hubspot website, July 28. Last modified April 17, 2017. Accessed August 21, 2020.
The Psychology of Personalization: Why We Crave Customized Experiences. https://blog.hubspot.com/marketing/psychology-personalization
Young, Indi. 2008. Mental Models: Aligning Design Strategy with Human Behavior. New York: Rosenfeld.