
Field research holds a special place for those who conduct it. It is also our anchor for relevance in the corporation. This paper explores the authors’ experiences with “ethno-mining”, a way of joining data base mining and ethnography. Since 2004 we have been using a variety of sensing and behavioral tracking technologies in conducting field research. We will present the main characteristics of doing ethno-mining, compare ethno-mining to other field research technologies, highlight the strengths of ethno-mining in co-creating data with participants and conclude by noting how the representations have opened new conversations and discourses inside the corporation. In this way, these new opportunities to collect sometimes counterintuitive data contributes to the research itself as well as the ongoing process of constructing oneself as relevant.
“Where are the visualization tools that allow the contradictory and controversial nature of matters of concern to be represented? … What is needed … are tools that capture what have always been the hidden practices of modernist innovations: objects have always been projects; matters of fact have always been matters of concern. … What I am pressing for is a means for drawing things together – gods, non-humans, and mortals included.”
Bruno Latour – keynote lecture for the Network of Design meeting of the Design History Society, Falmouth, Cornwall, 3 September 2008.
INTRODUCTION
Ethnography ain’t what it used to be. Recently anthropological writing has focused on the changing nature of what is “the field”, anthropologists’ relationship to participants in research, and bounds to research problems (Amit 2000; Blomberg 2005; Cefkin 2006; Cerwonka and Malkki 2007; Fabian and Marcus 2009; Gupta and Ferguson 1997; Rabinow 2005; Strathern 2004). Primarily the focus has been on theoretical issues raised by doing field research, despite the continued privileging of the firsthand account as a way of marking the field off from others. This paper is not about that. Theory plays a critical role in field research, but field research practices have also historically transformed alongside the introduction of new technologies, like tape recorders, cameras, and video. This is not to argue deterministically that technology has pushed field research to do certain things, but simply that our knowledge, like our informants’, shape and are shaped by the material world. We have recently had the opportunity to grapple with a new kind of technology to be used in field research—behavioral tracking technologies. As these become simpler, inexpensive, and more ubiquitous, anthropology will need ways of thinking about what these mean not just for societies at large, but for our own discipline, if anything. In this paper we will introduce a notion of “ethno-mining,” which was our way of understanding what these technologies might contribute to research, and describe some of the advantages and challenges that come with it in practice.
Ethno-mining is a tool that began life as an experiment within human-computer interaction (HCI) research communities to merge database mining and field research (Aipperspach 2007). We subsequently built on this work to employ it as a means to conduct cultural analysis. It combines the semi-automated collection and analysis of behavioral data with the collection and analysis of qualitative data in an open and iterative analytical framework, relying heavily on shared artifacts, in our case data visualizations, for the co-construction of meaning. The focus on cultural analysis (Bezaitis 2009) attempts to articulate symbolic meanings, cultural practices, and social situations surrounding a particular research topic. We provide this as contrast to other modes of field research within corporate settings that may focus on identifying personal motivations and individual needs. Instead, approach peoples as constituted by systems of interwoven meanings and practices, not as users of products with needs fixed a priori. One could think of this as the difference between finding findings and creating findings in partnership. In the same vein, we generally follow Marcus’s (1995) notions of multi-sited ethnography, where we are focused on research that looks across social, geographic, and cultural sites, rather than highlighting or exoticizing the particularities of one site, location, or context.
This is all to say that as we outline our use of ethno-mining, it is important to understand these epistemological assumptions, as they also structure the practical goals of research. Specifically we are arguing that when used in particular ways, data mining techniques, which have largely been developed for market research agendas (and for the purposes of furthering the panopicality it so often pretends), can nevertheless be used in ways that work well with the principles behind multi-sited ethnography, science and technology studies (STS) and other aligned traditions. In this paper we will present two aspects of ethno-mining: a) its use as an in-field tool and the analytic entanglements that it entails, and b) its use as a representational tool and its reception in corporate presentations. This paper will highlight the complexities and complicities of using ethno-mining.
HYBRIDIZATION, CO(A)GENTS AND ETHNO-MINING: OR, ETHNO-MINING IS A REESE’S PEANUT BUTTER CUP, NOT AN OREO
Many readers might recall those commercials where a kid comes home from school and gets an Oreo and a glass of milk. The first thing the kid does is separate the Oreo in order to eat the center first (or last). Reese Peanut Butter Cup commercials, on the other hand, emphasize chocolate and peanut butter going together to create something delightfully new. No one ever tries to separate the chocolate from the peanut butter because the joy is in the joining “two great tastes” into one. In theoretical circles, this joining is sometimes referred to. Michael’s (2004) recognizes how field research often has numerous kinds of interactions and relationships that are hybrids. To understand these relationships, he has developed an analytic framework around “co(a)gents”. He describes co(a)gents as “heuristic probes with which to examine and explicate relations, connections and interactions that are barely apparent but nevertheless serve in the (de)constructing of everyday routines” (2004:10).
Indeed, at the core, this is what we are attempting to do with ethno-mining. These data serve as co(a)gents to assist the researcher in deconstructing the phenomenon being studied. For example, a researcher might (as we document below) use traces of computer usage to provide a different lens on issues of temporality. In this way, ethno-mining is a hybrid, not a “mixed method”; it is two elements that cannot be separated out. Having said that, traces of each of the ingredients can still be seen – the same ethos of ethnography (open-ended, co-constructed, holistic field research) integrated with the empirical and analytical capacities of quantitative data mining. By integrating both automated data collection and discursive storytelling, ethno-mining does not separate out the quantitative and qualitative data from an ethnographic ethos. Numbers are treated in ways that surface qualities in addition to quantities.
WHAT WE DID
In our work, which was an exploration of computer usage and temporality, we employed detailed interaction logging on personal computing devices (laptops, netbooks, ultra-mobile PCs, and smart phones). In some studies, we have also asked participants to carry other behavior tracking devices, like cell phones outfitted to collect the participants’ physical location at the timescale of seconds. While such data does not provide a comprehensive view of all aspects of contemporary life, it does provide a deeper view into many aspects of contemporary human behavior. To help contextualize this tracking data, we rely on other ethnographic methods to collect data on the behaviors that are not tracked and on perspectives and meanings of the tracked behaviors that are not directly captured in the quantitative data. The various streams of data are integrated using the iterative analysis process described below.
Tracking people’s interactions with computing devices is possible through the affordances of the devices: specifically, they are designed for individual usage, they are readily available in many parts of the world, and they are portable. Furthermore, in the places where we have conducted our studies, in the US and parts of Europe, computing devices are common place and widely used; so tracking behavior through their usage was neither conspicuous nor significantly disruptive to the study participants’ lives. In terms of the variables we tracked, we collected details on the internal functioning of the devices as well as details on the types of information participants were accessing. This yielded a sense of where machines were being strained, but it also enabled us to create visualizations of the temporality with which devices were used. This enabled us to have discussions with interviewees about the relation between their feelings and experiences of busyness, and the computer. The interviews revealed the subjective conceptions of device use both as an activity in its own right and as a component in wider webs of activities that constituted relevant contexts around the usage (Rattenbury 2008).
As shown in Figures 1 and 2, the visualizations we created were evocative. That is, they were so complex that they required interpretation. The colors and times of day had a pattern that did indeed correspond to the device tracking, but were not directly obvious what color corresponded to what. Interviewees (and us researchers) would physically move back and forth, first close up then further away, find the right perspective to tell a particular story about what was happening. Decisions were being made about what the relevant scale of temporal experience was. Although not by design, it happened that the location tracking component sometimes indicated that a person switched locations when they had not. This served to remove some of the authority that participants tended to grant such ‘objective’ data, and made it much more comfortable for them to have something to explain. At times identifying what the colors could possibly represent—a ‘mistake’ or a movement, given their time of day and duration became a puzzle of sorts that generated the sorts of discussions about temporality that one simply cannot have otherwise. What began as a means of getting around impossibility of doing long term participant observation (see below) became its own mode of interpretation. It became no longer the poor man’s substitute for not being there, but its own nexus of meaning.
The formats of these visualizations are created by us, the researchers, and hence contain our perspectives on what might be interesting or meaningful findings. We tried, however, to leave the content in the visualizations in their rawest and most complete state—avoiding even simple transformations like taking averages or only displaying subsets of data. We have found that if these artifacts are to act as mediators, they must, in a sense, be foreign to both parties. That means that these visualizations are best designed in coordination with certain principles in mind. First, they ought to include as much data as possible, to allow for as much iteration between findings and framings as possible, and to give both the researchers and participants plenty of material to construct narratives in the joint-interpretation process. For example, we included user inputs like key clicks and mouse movements, application use, location, etc., without knowing apriori which would be the important indicators of what someone was experiencing temporally. Second, they ought to provide enough interpretive space (or ambiguity) for the researchers and study participants to generate multiple complimentary and competing narratives. Here we kept the labeling of the colors at some physical distance, and exploited the accident of inconsistent location sensing. Finally, and in some tension with the latter, visualizations ought to be visually accessible/legible by both the researchers and the study participants. Complete data occlusion ceases to be evocative. In every interview, we found that brief oral descriptions of how one might read some small portion of it (e.g., the middle of the chart is the middle of the day, the colors correspond to programs you used, etc.) were sufficient to enable study participants to effectively incorporate our visual language into their thinking. After about five minutes, all our participants established certain fluency and artfulness in reading this data that otherwise is there to make the familiar seem strange.
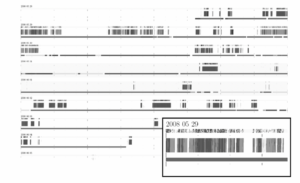
FIGURE 1 This figure displays part of a data visualization used during an ethno-mining contextual interview. The visualization plots computer use and relative user location. Each day of data is plotted horizontally, from midnight to midnight. The zoomed in portion of the figure (bottom-right) plots a little more than 3.5 hours of May 29th, 2008 for a single user. The top portion of each day’s plot corresponds to user input (the denser the markings, the more the user was typing on the keyboard or using the mouse). The thick center line for each day plots the focal application (each application is assigned a unique color). The bottom line for each day plots the user’s relative location—separate locations are assigned separate colors; however the physical or semantic identity of each location is unknown.
What started out as obtuse and not intuitive quickly became something intriguingly interpretable, and indeed personal. Participants often asked for copies of them afterwards, as the process of interpreting it gave them a different way of seeing a short interval of their life. In our case, the visualizations allowed us to have a conversation with middle class Americans about time use that helped both them and us get beyond the dominant and highly charged discourses of being busy (Darrah et al. 2007, Shore 2003), while at the same time creating enough space to observe when and how this discourse is made visible and invisible, what activities are consistently enrolled in its frame and which are not. People began to question for what, exactly, one was ‘busy’ and under what circumstances. It evoked multiple connections to wider contexts, and exposed a number of implicit assumptions about the data and its semantic status in both researcher and participant. This proved to be more informative than trying to observe or interview about such assumptions. The co-construction of meaning enabled traces of computer use to be more than simply a way of capturing patterns of minutia that people might not themselves remember. It created a third space in which interpretive frames might be negotiated and re-negotiated. It surfaced, as Latour has called for, the contradictory and controversial nature of matters of concern (see epigraph).
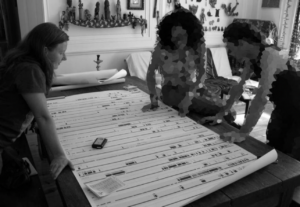
FIGURE 2 This photograph illustrates the collaborative interpretation of data visualization during an interview. The data visualization in this photograph is the same as in Figure 1.
ETHNO-MINING IN RELATION TO IMAGE CAPTURE TECHNIQUES
Like video, photographs, and time diaries, ethno-mining attempts to capture observable behavior in a ways that facilitate analysis. The data that is automatically collected through sensors and other technologies we refer to as behavior tracking data (ethno-mining being the iterative research process described above). Behavior tracking data broadly includes any numerical data that registers some consequence of an individual or group of people acting in the world: e.g., their physical Movements, their interactions with physical or virtual objects/information, their interactions with other people, their health, etc. In this sense, we are celebrating Strathern’s claim that “social anthropology has one trick up its sleeve: the deliberate attempt to generate more data than the investigator is aware of at the time of collection … a participatory exercise which yields material for which analytical protocols are often devised after the fact” (Strathern 2004:5). There is continuity to be found with traditional1 ethnographic research tools.
To the extent that ethno-mining produces an excess of data, we find ethno-mining to be analogous to descriptions of using video from the 1990s. Suchman and Trigg (1991) were able to capture interactions and behaviors that would have perhaps been otherwise unnoticed or unseen through video. The sensing and tracking software that we have today can similarly capture data related to the often unseen or unnoticed. For example, in our study we could easily track behavioral events at sub-second timescales, 24 hours per day for multiple weeks or months, or even years, and simultaneously for hundreds of people. In addition to gaining a wider view into human behavior, some of the data can also track the direct impact of these behaviors on physical and virtual environments (e.g., on the physical and virtual computing infrastructure: Ratti 2006). There is more at work than a mere glut of data points. Images can surface which we do not see for its familiarity, or more embodied, less discursive, forms of knowledge. It is only upon reflection that photos or videos take on their new relevance, when combined with other sources of data input. Ethno-mining works in a similar manner, in the sense that what at once is unremarkable becomes a pattern of note when combined with other data sources.
There is a tension, however, just as there has historically been a tension with other technologies in fieldwork. Ethnography in corporate settings is often embraced as a method of observation (Sunderland and Denny 2007). Observation carries with it notions of transparency of meaning and the capturing of facts. Observational data is a key part of what makes research trustworthy in corporate settings. Conceived of in this way, ethnography carries symbolic ties to the natural sciences with the obsession around observing and counting as facts, rather than the interpretations, co-creation and social production of insights. Popular media reflect this the notion, often highlight the behavioral observation aspect of conducting field research, an article that featured Intel in Business Week (2006) started with a with a picture of “ethnographer” in lab coats looking down into a house to observe people. Similarly, in the film Kitchen Stories, which is a dramatization of a relationship between an observer and the observed, the observer, sits in a comically high chair in the corner. The chair symbolizes the distance between observers and observed which over time becomes even more preposterous and breaks down.
In corporate settings, many technologies in field research are used to present work as akin to scientific observation studies of behavior—resulting in the rapid adoption and widespread use of data capture devices in these contexts. Tape recorders, cameras, and video tape have all been field research tool additions that have changed how field research is done (a few examples from video: Askew and Wilk 2002; Barbash and Taylor 1997; Ginsburg, Abu-Lughold, and Larkin 2002; Pink 2001; Ruby 1980, 1991) and relationships with participants2 in research. Indeed, when much of what has been recognized as classic field research was conducted in anthropology, these technologies were rare, if used at all. Today, photography and video hold a central position in field research, particularly with the research being done for corporations as for managers they signify that scientific research is being done. These are the technologies that have been used to capture behavior and also to represent data to corporate audiences. In the last seven years, to our knowledge we have not seen a request for proposals (RFP) go out from companies to consultants for ethnographic work that does not assume video recording as part of the research technique and representational deliverable.
We see ethno-mining as being very similar to these technologies, particularly video, in terms of the appeal beyond academia. It also raises similar fieldwork issues around what the data means, relationship to participants, and the public reception of how these are represented. Photography and videography can both work to distance the researcher from the participants in the study (Wakeford 2005). The technology itself literally can become the filter through which the researchers and participants interact. This creates a sense of “objective” distance – as something happening over there that “scientists” can observe from over here. The behavior tracking data aspect of ethno-mining can be viewed similarly. Tracking data by itself, not as part of ethno-mining, similarly gives the appearance that researchers are objectively removed from the participants and the research sites. However, it can, as we outlined above, be used as a component for building relationships with participants, ultimately enabling new narratives from them. In our case, this interpretive bent is more than just in how the data is used, and extends to how it is created and given material form. The visual form we give it goes to some lengths to make very clear that tracking data is not ‘true’ in any straightforward sense, but awaiting social interpretation, (de)construction and debate.
Nevertheless, like previous technologies, behavior tracking has the potential for dual reading—e.g., the researcher might unpack and interpret it for the benefit of a stakeholder, and design a visualization that frustrates attempts at a reductionist reading, and nevertheless it might be (and at times in our experience has been) taken to be “transparent” data collected (Nafus and Anderson 2005). Ethno-mining carries with it the same risk. Just as images of, say, a photo of a child putting up graffiti on a wall in a favella might be made to be ‘transparently’ about Brazil as a nation of starvation and lack of opportunity, so too ethno-mining can be interpreted as more “real” or truer than other methodologies anthropologists employ. Indeed, as we document below, this slippage affords both a foot in the door in strategy discussions and product planning efforts, and yet immediately becomes a constraint as engineers struggle with the idea that numbers require interpretation beyond back of the napkin common sense-making. This is all to point out that, simply, there is a long history of this sort of problem, well before ethno-mining techniques became possible. While there are measures that can be taken to encourage a more careful interpretation, —i.e., using it in a soft way to explain what ethnography is to those otherwise inclined—the opposite can (and often does) happen.
Before we discuss the representational politics of ethno-mining, one further comparison with previous technologies is worth noting. What ethno-mining does particularly well is it extends the social, spatial and temporal scope of research. Indeed, we created this technique as a response to the temporal pressures of working in industry that prohibit field research of any length. In cases where it is not feasible to literally spend months on end in the company of a research participant, ethno-mining can provide some set of clues about what may have transpired between visits, or at least a way of talking about it. In this way it has the ability to resurface, though not replicate, some aspects of serendipity that long-term Malinowskian fieldwork was built to capture. But it also reminded us, in a new way, of the constraints and limitations participant observation has always had. For example, in attempting to follow where people used their laptops around the house, we employed location sensing technology on the laptop, rather than video cameras, because we could track the usage of the laptops when they were used in bed—not join people in bed.
We remind readers that behavior tracking cannot be relied upon to be the sole method of field research for the purposes that ethnographers are usually hired. The behaviors which manifest themselves through track-able objects tell a partial story—a very small slice of much larger lives. We do believe, however, that it does powerfully extend our field research tool kit and does not, a priori, lead one down a slippery slope into panopticality and complicity in the growing culture of audit and surveillance.
PRACTICALITIES
We have discussed the relative advantages of using ethno-mining; however, we should also make some note on the pragmatics of using this approach in field research. The primary design trade-off that must be balanced when choosing a device, or devices, to collect behavior tracking data is minimizing disruption to the study participants while maximizing comprehensiveness of the data. This is particularly acute in cases where the participant is carrying around a device most, or all, of the time (e.g., the data collection device used by Clarkson (2002) is far too conspicuous and invasive for a large sample size study). This entails ensuring that the data collection device is fairly inconspicuous, making sure that the devices have sufficient power (or recharging capabilities) for the duration of the study, the collected data is stored and transferred in a reliable way. For example, our first few attempts struggled with off-the-shelf GPS systems, which required a recharge in the middle of the day and contained only enough data storage for a day’s worth of readings. This meant that the burden on participants was not reasonable and that aspect of the research had to be abandoned.
While location sensing at first appears to be the obvious candidate for behavior tracking, it is worth thinking expansively about the kinds of sensing that are possible. For example, clicks on a keyboard got us a sense of temporality that location did not. Care (and a sense of experimentation) needs to be given to thinking through which devices are capable of detecting which aspects of participants’ lives, and whether the data collected can reasonably be expected to bear some link to data collected via other ethnographic techniques. For some purposes, the points at which there is a disconnect that might also be useful. For example, our work tracked spikes of CPU utilization, some of which was user-driven and some of which was machine-driven. For those inclined towards actor network theory, these new and old ways of linking goings-on in the non-human world (here, the CPU) and the human world may in fact be particularly evocative.
CORPORATE IMPACT
We used data that looks curiously similar to data mining in order it to create common ground with research participants, who make their own interpretations of its meaning. Common grounds might also be created with others who also have stakes in the research. Corporations all too often struggle to understand the seriousness of qualitative insight. Arguments are all too often made invisible, as if done by voodoo, if they are not told through numbers. In the way that ethno-mining works to de-naturalize the apparently ‘empirical’ and create a common problem to be interpreted by both research participant and researcher, it has value, too, for the wider enterprise.
In our own case, we see our own use of quantitative data as engaging with two, fairly distinct, subcultures that privilege quantification in their own ways—engineering and econometrics. Companies are engaged in discourses, both internally (operationally) and externally, that center on quantified measurements of their financial viability and success. These measurements are used both retrospectively and prospectively—to assess what happened and what might happen. To engage in operational discussions, researchers at Intel must often translate their opinions, findings, ideas, etc. into numbers: how many people did you interview, how many of them displayed a particular behavior, and how many of them can we rely on to conduct this behavior in the future, etc. The engineering parts of our company work in astounding levels of quantitative precision. This precision is required to build micro-processors, the components of which might as well be considered nanotechnology. Consequently, to engage in a discussion with engineering groups of our company, we have to translate the description of our findings into precise quantitative terms. This translation does not need to be complete – i.e., we do not have to generate reports that are entirely composed of precise, nanosecond-by-nanosecond measurements. However, we need to identify crucial intersections between our findings and the concerns of the engineers in our company, and then find ways to quantify aspects of our findings in these intersections.
By expanding the sample size and directly measuring some aspects of behavior, researchers can, in fact, perform this kind of expected quantification. But perhaps more importantly, it can render the wider ethnographic thinking more palatable overall. For example, from our study of time use and technology in middle class America, we have indeed spread within our own company something of an understanding of the lived and perceived temporality of computer use and daily life. The appearance of numeric data gets us “in the door”, but the insights from ethno-mining provides us with a continuous place “at the table”. For example, our understanding of the temporality of daily American life touches on many topics that extend well beyond computing devices and their use. That said, this temporality does provide explicit implications for technology design like managing system responsiveness and power management at the time-scale of seconds and minutes instead of tens of minutes or hours (Rattenbury 2008). These engineers don’t necessarily know why people do things in this way, though other parts of the company does.
This does not mean that the qualities go out the window in the interest of corporate expediency. Earlier we emphasized the quality, not quantities of numbers and the co-creation of research insights with participants. Just as we have worked to create new kinds of representations of data to use with participants in our field research, so too we’ve labored on new ways to present ethno-mining materials internally to the corporation. Ethno-mining, by having the appearance of capturing “real” data, also affords the opportunity to share its messiness, allowing for a co-creation of interpretation in corporate meetings as well as in field research. Figure 3 is a chart of time of day of computers from a study we did on notebooks. The x-axis represents the hours of the day, from midnight to midnight. Each line on the y-axis represents a participant in the study. The more yellow spots on the y-axis line, the more the computer was used during that time segment over the ~8 weeks of the study.
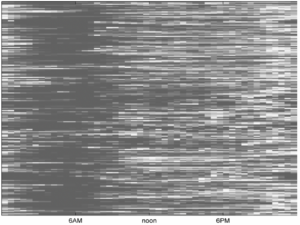
FIGURE 3 This data visualization was used during presentations to senior management, new product planners and platform engineers. The figure illustrates how we have attempted to demonstrate heterogeneity of the data and call into question the transparent reading of “facts” of quantitative data. Each line of the y-axis is a participant in our study. The x-axis is time, from midnight until midnight.
If we were just taking a quantitative approach we could present a “fact” that 40% of usage happens from 6-midnight, 10% from midnight to 6AM, 20% from 6AM until noon and 30% from noon until 6PM. Indeed such facts were asked for and we resisted providing them. Instead, we held a discussion about what was and was not predictable about computer use in conditions of such temporal heterogeneity. When presenting this material, colleagues in the meeting are not always sure what to make of the data. Indeed, this is one of our goals in presentation, to open interpretation by calling into question “the known” and what are “facts”. The representations allow us and colleagues in a meeting to challenge the objectivity, reliability and neutrality of “facts,” ironically by being even more fact-like. This becomes an occasion to highlight why this temporal heterogeneity matters so much culturally, where the precise schedule and management of time has become the dominant way of understanding temporal experience. Here, we are able to use the data combined with our cultural analysis to highlight the heterogeneity of participants, to bring to the foreground the multi-dimensionality of the lived experience by multiple people in multiple places. Engineers and managers could come to see this more readily through the lens of something they felt far more intimate with—the machine.
Since representations of participant behavior have relatively high power within our corporation, we are presenting another example from one of our presentations. In this case, in Figure 4, the x-axis corresponds to participants in the study, while the y-axis is the percent of the incidents of sessions and the colors represent different durations of sessions.
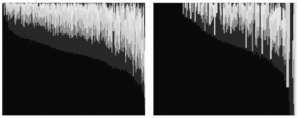
FIGURE 4 This data visualization was used during presentations to senior management, new product planners and platform engineers. Each vertical set of stack bars corresponds to a separate study participant. The colors represent different events (in this case durations of computer usage) and the heights of the bars give a relative probability of occurrence for each of these events, for each participant.
The data could be presented as a table, for example:
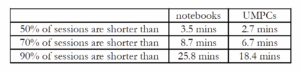
Presented as such, the “facts” leave little room to include a discourse on the social nature of temporality–why, for example, the longer session remains a significant part of usage even for those who skew most radically to the brief interaction. Instead, presenting the behavior tracking data visually in a more complete way affords an opportunity to highlight the importance of our cultural analysis while grounding the conversation in a concrete shared object of charts from the ethno-mining data.
Visualizations such as these allow us to recast a single, coherent set of findings differently, relative to different audiences. In the two cases above, we could use one narrative line with engineers, needing to focus on engineering decisions for computer platforms in 2015, while using the same charts and data, we were able to carry on a completely different narratives around what people’s “needs” will look like in 2015. Ultimately, ethno-mining produces rich findings—where “rich” here means multi-faceted, interwoven (with multiple narratives), and connected to wider contexts. This richness is achieved by collecting multiple types of data, working inventively and collaboratively with study participants to interpret this data, and working iteratively to identify a multiple of connections between findings and contexts—i.e., to treat the phenomena of study as matters of concern, instead of matters of fact.
CONCLUSION
We have presented an overview of our use of ethno-mining, a method that combines the ethos of ethnography with database mining techniques around behavioral data. We have argued that technological advancements in hardware and software provide an opportunity to make ethno-mining as core to the field research tool kit as video and photographs are today. As with all technologies and techniques in field research, ethno-mining comes with some risks, as well as rewards. On the rewards side, we particularly found behavioral data representations with participants in the field were an effective tool in the co-creation of research data. Whether one adopts something like ethno-mining or not, it does call into question what we, as a field, are doing around new field research techniques. Predominately, the innovative techniques that have emerged in practice in recent years have come through design research practices, not anthropology. For example, design researchers have created games like “Digital Street Games” (Chang 2004) as a method to learn more about notions of public and private. In another in-house project, researchers asked participants to document their lives, from a sensor’s point of view. While creative, imaginative and insightful as these techniques have been, ethno-mining has enabled us to be perceived as having impact and staying relevant during these economic down times through its perceived seriousness. Indeed, we have developed new audiences since earlier times when we were primarily about innovation (Salvador). With corporate partners we are having different conversations around things like the “consumerizing” of corporate technologies (Nafus 2009) and strategy and planning groups (Anderson 2009), where tools beyond our innovation tools were needed. The use of ethno-mining has been so accepted into the company that requests for including ethno-mining in our research and results have matched the kinds of requests we had four or five years ago for doing video with field research. We only hope that careful use and reflexive practice of doing ethno-mining continues to work against the strong corporate impetus to simply create more data, but still deliver actionable insight and robust field studies.
NOTES
This research could not have happened at Intel without the support and assistance of Maria Bezaitis, Ashley Mccorkle, Joyce Hao, Sasha Roseneil, Cristina Santos and Mariya Stoilova. We thank Allison Woodruff for thoughtful comments on both the method and this paper.
ken anderson is an iconoclast by nature and symbolic anthropologist by training. He currently conducts anthropological research in Intel Labs focusing on the importance of participation in technology practice, design and adoption.
Dawn Nafus is an anthropologist Intel, where she conducts social science research to inspire new products and strategies. She holds a PhD in Anthropology from Cambridge University, and was previously a research fellow at University of Essex. She has published widely on communication technology and society in academic journals, and worked with both public policy makers and industry leaders on issues such as widening participation in open source communities and knowledge transfer policies for local economic development. Her recent work has focused on technology and time use. Her areas of regional expertise are Russia and the UK.
Tye Rattenbury is a researcher in the People and Practices Research group at Intel. His research interests revolve around mixed-methods studies of technology use and adoption. Tye holds a PhD in Computer Science from the University of California, Berkeley and a BS in Applied Mathematics from the University of Colorado at Boulder.
Ryan Aipperspach has an MS in Computer Science from the University of California Berkeley, where he studied at the Berkeley Institute of Design. There, his focus was on studying and developing portable domestic technologies. He is currently on leave developing GoodGuide.com, a website to help people find safe, healthy, and green products.
1 We give a nod to Nina Wakeford (2005) on the words “traditional ethnography” – “The term traditional ethnography makes me shudder, as much as the term family tradition does.”
2 We have used the term “participants” to refer to people in our studies since the 1980s. We highlight this use because it notes that these people are participating, co-creating with us our data, findings and insights. By focusing on participation, it has us thinking carefully about methods we use and how we use them. We contrast this to other common terms like: informant, respondent, subject, which all signify a different relationship in field research.
REFERENCES
Agar, Michael
2004 We Have Met the Other and We’re All Nonlinear: Ethnography as a Nonlinear Dynamic System. Complexity 10(2).
Aipperspach, Ryan et al.
2006 Ethno-Mining: Integrating Numbers and Words from the Ground Up, EECS Department tech-report, UCB/EECS-2006-125, University of California, Berkeley.
Amit, Vered, ed.
2002 Constructing the Field: Ethnographic Fieldwork in the Contemporary World. London: Routledge.
Anderson, Ken
2009 Ethnographic Research: A Key to Strategy. Harvard Business Review. March:24-25.
Askew, Kelly and Richard R. Wilk, eds.
2002 The anthropology of media: A reader. Malden, MA: Blackwell
Barbash, Llisa and Lucien Taylor
1997 Cross-cultural filmmaking: A handbook for making documentary and ethnographic films and videos. Berkeley, CA: University of California Press.
Bezaitis, Maria
2009 Practices, Products and the Future of Ethnographic Work. In Proceedings of EPIC2009. Hoboken, NJ: Wiley Blackwell.
Bolger, Niall with Angelina Davis and Eshkol Rafaeli
2003 Diary Methods: Capturing Life as it is Lived. Annual Review of Psychology. 54:579-616.
Business Week
2006 The Science of Desire: As more companies refocus squarely on the consumer, ethnography and its proponents have become star players. Business Week, June 5th, 2006. Also found on-line at: http://www.businessweek.com/magazine/content/06_23/b3987083.htm
Cefkin, Melissa
2005 Cultural Transitions – WWMD? Ethical Impulses and the Project of Ethnography in Industry. Proceedings of EPIC2005. Arlington, VA: American Anthropological Association.
Cerwonka, Allaine and Liisa H. Malkki
2007 Improvising Theory: Process and Temporality in Ethnographic Fieldwork. Chicago: University of Chicago Press.
Chang, Michele and Elizabeth Goodman
2004 Digital Street Games: Games as method. Poster presented at Ubicomp2004, Nottingham, UK. Sept 7-10, 2004.
Clarkson, Brian P.
2002 Life Patterns: structure from wearable sensors, unpublished doctoral dissertation, MIT Media Arts and Sciences.
Creswell, John W. and Vikcki L. Plano Clark
2006 Designing and conducting mixed methods research. Thousand Oakes, CA; Sage.
Darrah, Charles with James M. Freeman and June Anne English-Lueck
2007 Busier than ever!: why American families can’t slow down. Palo Alto, CA:Stanford University Press.
Ellegård, Kajsa and Matthew Cooper
2004 Complexity in daily life – a 3D-visualization showing activity patterns in their contexts, electronic International Journal of Time Use Research 1(1).
Ginsburg, Faye, with Lila Abu-Lughod, and Brian Larkin eds.
2002 Media worlds: Anthropology on new terrain. Berkeley, CA: University of California Press.
Gonzalez-Chapela, Jorge
2006 On measuring heterogeneity in the use of time, electronic International Journal of Time Use Research 3(1).
Gupta, Ahkil and James Ferguson, eds.
1997 Anthropological Locations: Boundaries and Grounds of Field Science. Berkeley: University of California Press.
Kubey, Robert with Reed Larson and Mihaly Csikszentmihalyi
1996 Experience Sampling Method Applications to Communication Research Questions, Journal of Communication 46(2):99-120.
Latour, Bruno
2008 A Cautious Prometheus? A Few Steps Toward a Philosophy of Design (with Special Attention to Peter Sloterdijk), unpublished keynote lecture for the Network of Design meeting of the Design History Society, Falmouth, Cornwall, 3 September 2008. http://www.bruno-latour.fr/articles/article/112-DESIGN-CORNWALL.pdf – accessed 16 May 2009.
Fabian, James D. and George Marcus, eds.
2009 Fieldwork is Not What it Used to Be: Learning Anthropology’s Method in a Time of Transition. Ithaca, NY: Cornell University Press.
Michaels, Mike
2004 On making data social: heterogeneity in sociological practice. Qualitative Research 4 (1): 5-23.
Michelson, William
2006 Time Use: Expanding Explanation in the Social Sciences. Boulder, CO: Paradigm.
Moskowitz, D., with K. Brown and S. Côté
1997 Reconceptualizing Stability: Using Time as a Psychological Dimension, Current Directions in Psychological Science 6(5)127-131.
Nafus, Dawn, with Rogerio de Paula, Kathi Kitner, Scott Mainwaring and Tye Rattenbury
2009 Consumerization and Renewing PaPR. In Proceedings of the EPIC2009. Hoboken, NJ: Wiley Blackwell.
Pink, Sarah ed.
2001 Doing visual ethnography: Images, media and representation in research. Thousand Oakes, CA; Sage.
Rabinow, Paul
2005 Midst Anthropology’s Problems. In Global Assemblages: Technology, Politics and Ethics as Anthropological Problems, ed. A. Ong and S. J. Collier, 40-53. Malden, Mass: Blackwell.
Rattenbury, Tye with Dawn Nafus and Ken Anderson
2008 Plastic: A Metaphor for Integrated Technologies. Proceedings of the International Conference on Ubiquitous Computing, 232-241.
Ratti, Carlo with Riccardo Maria Pulselli and Sarah Williams and Dennis Frenchman
2006 Mobile Landscapes: using location data from cell-phones for urban analysis, Environment and Planning B: Planning and Design 33(5): 727-748.
Ruby, Jay
1980 Exposing yourself: Reflexivity, anthropology and film. Semiotica 20 (1/2): 153-179.
1991 Speaking for, speaking about, speaking with or speaking alongside: An anthropological and documentary dilemma. Visual Anthropology Review 7 (2): 50-67.
Shore, Bradd
2003 Class Acts: Activity Fetishism and Busyness as Usual. Paper presented at the American Anthropological Association Meeting. November 2003
Strathern, Marilyn
1999 Property, Substance and Effect: Anthropological Essays on Persons and Things. Athlone Press.
2004 Commons and Borderlands: Working papers on interdisciplinarity, accountability, and the flow of knowledge. Oxford: Sean Kingston
Suchman, Lucy and Randall Trigg
1991 Understanding Practice: Video as a medium for reflections and design. In Design at work: Cooperative designs for computer systems, edited by J. M. Greenbaum and M. Kyng, 65-89. Hillsdale, NJ: L. Erlbaum Associates.
Wagner, Roy
1975 The Invention of Culture. University of Chicago Press.