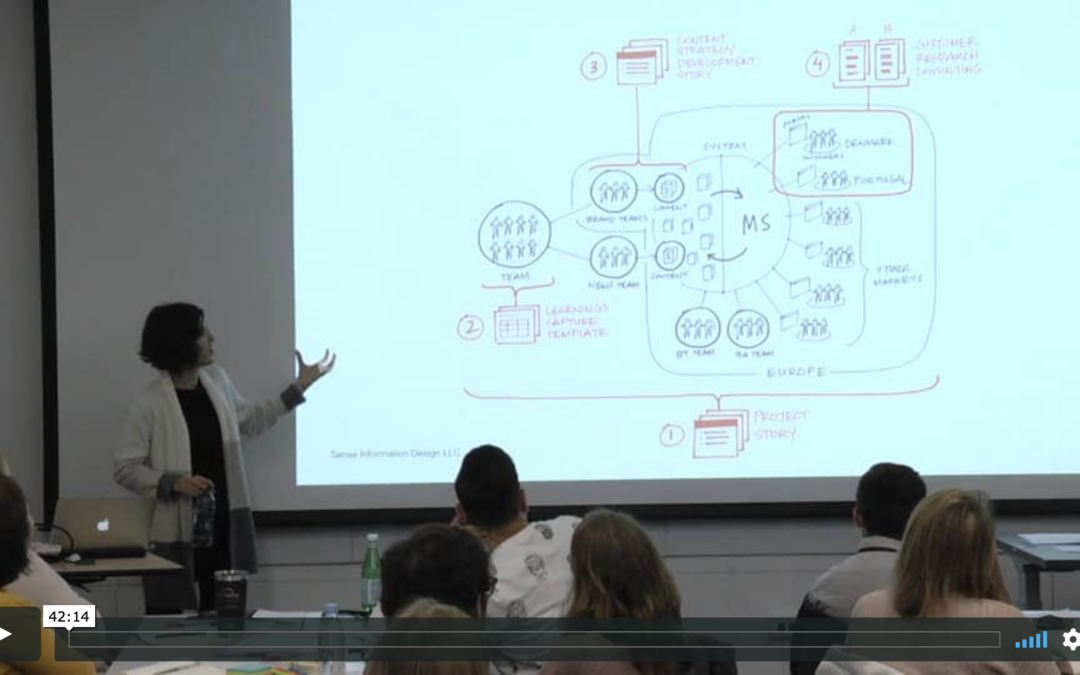
Overview Ethnographic analysis is the examination of raw data with an interpretative lens to identify themes, connections and patterns. How can you make this process more accessible to support data socialization...


Overview Ethnographic analysis is the examination of raw data with an interpretative lens to identify themes, connections and patterns. How can you make this process more accessible to support data socialization...

EPIC Profiles Series At 7 am sharp on a Monday morning, Skype broke the silence with an incoming call. On the line was an affable, well-spoken woman with a British accent. It was Elizabeth Churchill, a familiar name in the EPIC community and a founding member of its steering committee. It was a...
![The Invisible Work of Being a Patient and Implications for Health Care: “[The Doctor Is] My Business Partner in the Most Important Business in My Life, Staying Alive”](https://www.epicpeople.org/wp-content/uploads/2023/08/sam-T2r9oWS-NDQ-unsplash-scaled-e1693362877450-1080x675.jpg)
In a distributed system of care, patients shuffle among many clinicians and spend the majority of their time away from the treatment center. Although we see the results of patients’ work (e.g., medication taken, arrived at appointment) we do not see the work itself. By failing to see this...