
A senior leadership team gathers in the executive boardroom. The doors are closed; the glass is opaque. Sparkling water is served. Projected on the conference screen is not a financial statement, or an operating report, but instead, an intricate diagram resembling a map or relational lineage. The subject of the meeting is the company’s reorganization – a “reorg.” Perhaps a desperate cost-cutting measure, or perhaps a tactfully planned efficiency boost, this reorg is led by a team of outside management consultants who drew the diagram slide and now lead the meeting. A confluence of rectangular boxes – “heads” – are organized according to hierarchy, with the CEO (and her board) on top; one notch down are the leaders of each business unit – Product, Sales, Finance, Human Resources. But the way these organizational charts will be re-drawn is not a purely functional exercise – like map-making, it is deeply symbolic and imbued with power.
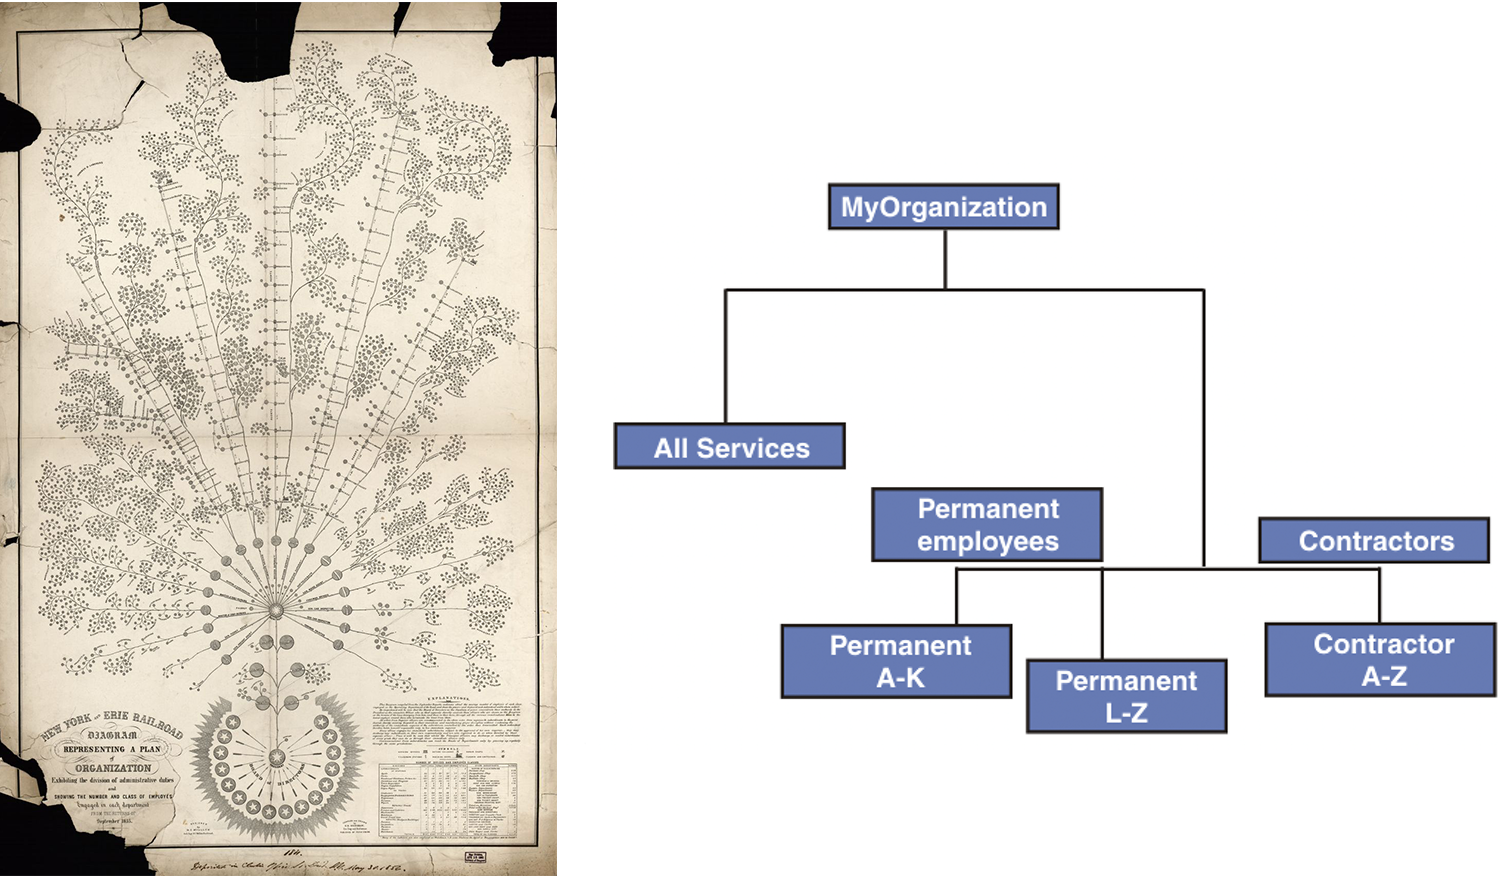
Figure 1 (left): First organizational chart by Daniel McCallum, depicting Erie Railway in 1855. The CEO sits at the center of the chart, with each “branch” of the business extending outwards. Figure 2 (right): Hierarchical Organizational Chart from the IBM Knowledge Center, 2017.
An ‘org chart’ is a diagram representing the structure of an organization and the relative roles and hierarchies within it. They come in various forms: matrix-style grids, box-and-line charts, flow charts relating business units, or spreadsheets listing supervisors at each level. The first org chart was an intricate, tree-like diagram (Fig. 1), designed to create more transparency and accountability in a railroad company. Today, despite a proliferation of visualizations representing a variety of trends, the most commonly used org chart in management consulting is still the humble hierarchical organizational chart (Fig. 2).
Why do we use org charts? For businesses, it is an easy to communicate, efficient way to represent the organization and its various functions. For consultants, it is both the starting point and output of any organizational restructuring – whether it is a merger, divestment or cost cutting initiative.
But org charts have several limitations: they are static where organizations are dynamic; they represent linear hierarchies where human relationships are decidedly non-linear. It is rare that org charts correctly represent an organization, and any semblance of ‘correctness’ is desperately transient. On Day Zero of a merger, hundreds of employees are hired and hundreds are fired. The Day Zero org chart – detailed the night before – is already outdated.
Yet for consultants and their clients, getting an org chart ‘right’ – however that is understood – is a critical matter. Hours are spent in workshops, not debating the future state organization, but identifying the ‘correct’ current state. Does a salesperson physically based in California reporting to a manager in New York belong to the Northeast or the West division? Where is the Senior Advisor – who manages no people, whose role and commitment often fluctuates – depicted?
There are no correct answers to these questions, but they matter because org charts are not simply neutral representations of an organization. They are the inter-subjective rendered objective. Like maps, org charts – and the negotiated, political processes by which they are created – reify the power of certain individuals in an organization. The placement of names on the map is critically important, even if it doesn’t comport to how the business is run. For example, business executives often demand that they see their Executive Assistants somewhere visually on a page that represents the boundaries of their control, even if their payroll (and reporting line) actually rolls up to a central Administrative division. The org chart-as-map becomes an authoritative practice for making political claims on resources within the company.
The map’s symbolic role in regulating power has been long studied in the field of international relations. Territorial statehood and linear boundaries have defined international politics since the 16th century.1 Prior to this, political power took the form of heteronomous organization and transcendental political identities – like a complicated matrix organization, power emanated both horizontally (across the papacy and the German Empire) and vertically (downwards toward the subordinate civil societies of Europe), mirroring the Mandala System of Indic Kingdoms in South and Southeast Asia.2 The orthodox Westphalian myth attributes the origin of modern states to the 1648 treaties that ended the 30 Year War, but newer scholarship points to the cartographic methods of political control that developed during the 16th century Spanish conquest of Amerindian civilizations. Maps were central to Spanish claims – and English/French counterclaims – to so-called New World territories. By the 17th century J. Branch writes that “the use of abstract, cartographic territoriality to assert control [became] unmistakable.”3
Like the modern state system, legitimate authority in the business organization is defined by linear cartographic boundaries. To fulfill its purposes of creating ‘transparency’ and ‘accountability’, the organizational chart must represent authority in exclusive, homogenous terms. The line between a CEO and their business leaders is the same length as that between a low-level manager and their entry-level employees. A single person should report to one manager. An Executive Assistant who answers to two division heads – as citizens in the pre-modern European medieval world answered to the authority of the pope and the German king – obstructs the org chart; their loyalty must be exclusively defined to be correctly represented.
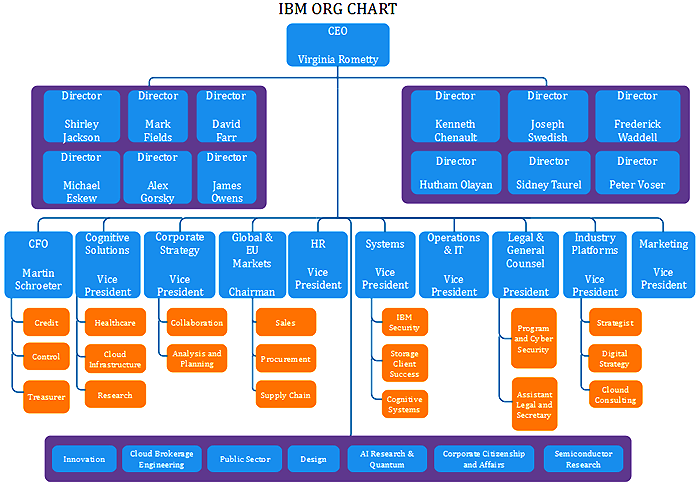
Figure 3, Organizational charts geographize business relations with a semblance of equity that does not map to practiced reality.6
The homogeneity represented on the org chart obscures important differences. One executive may be a trusted advisor to an entire business unit, devoting countless time and attention to ensuring smooth operations. Another executive on the same level may be absent and unavailable. A look at an org chart won’t tell you if the VP of HR is a great or revisionist power in the system. Because they sit at the same level, presumably they are called into the same executive meetings, are parts of the same management workshops and must be treated by employees with similar respect. That is the power of the org chart: it reifies certain hierarchies that it is meant to merely represent.
In a recent cost-cutting process (separate from the opening analogy), it came to light that the Supply Chain Finance Manager hadn’t kept the Supply Chain’s org chart updated. The Supply Chain was the largest division of the business by employee number, with slightly over one thousand employees where other divisions had five hundred or fewer. Not only had the Finance Manager failed to keep track of changes in reporting relationships in his division, he hadn’t kept the employee roster updated, which meant that no accurate headcount of employees existed for his division. For any re-org, this would be negligent: without a clear cartographical starting point, it was difficult to know where to go next. But for a cost-cutting process, when one’s resources are actively threatened, losing the map is disastrous. Without an org chart, the Supply Chain division VP had difficulty pushing back when consultants and other division VPs demanded greater cuts from his division. In the end, the Supply Chain division accepted the biggest cuts of the entire company. On this basis of this mistake, the Finance Manager was fired in the middle of the cost-cutting process. Without a map, others redraw the lines in their favor – and one loses political authority in the process.
In another cost-cutting process, a company was suffering retention problems due to falling profit margins. A number of ‘boxes’ on their org charts were therefore functionally empty – in one division, as many as one third of the positions were unfilled. However, consultants had defined the starting point of the cost-cutting process as the company’s official org chart, and as a result the majority of the ‘efficiencies’ facilitated by the consultants came from managers cutting unfilled positions. Just as the European empires fabricated and claimed empty spaces of the New World territories with maps, this consultant’s success was claimed by re-drawing the org chart – with a different reality on the ground.
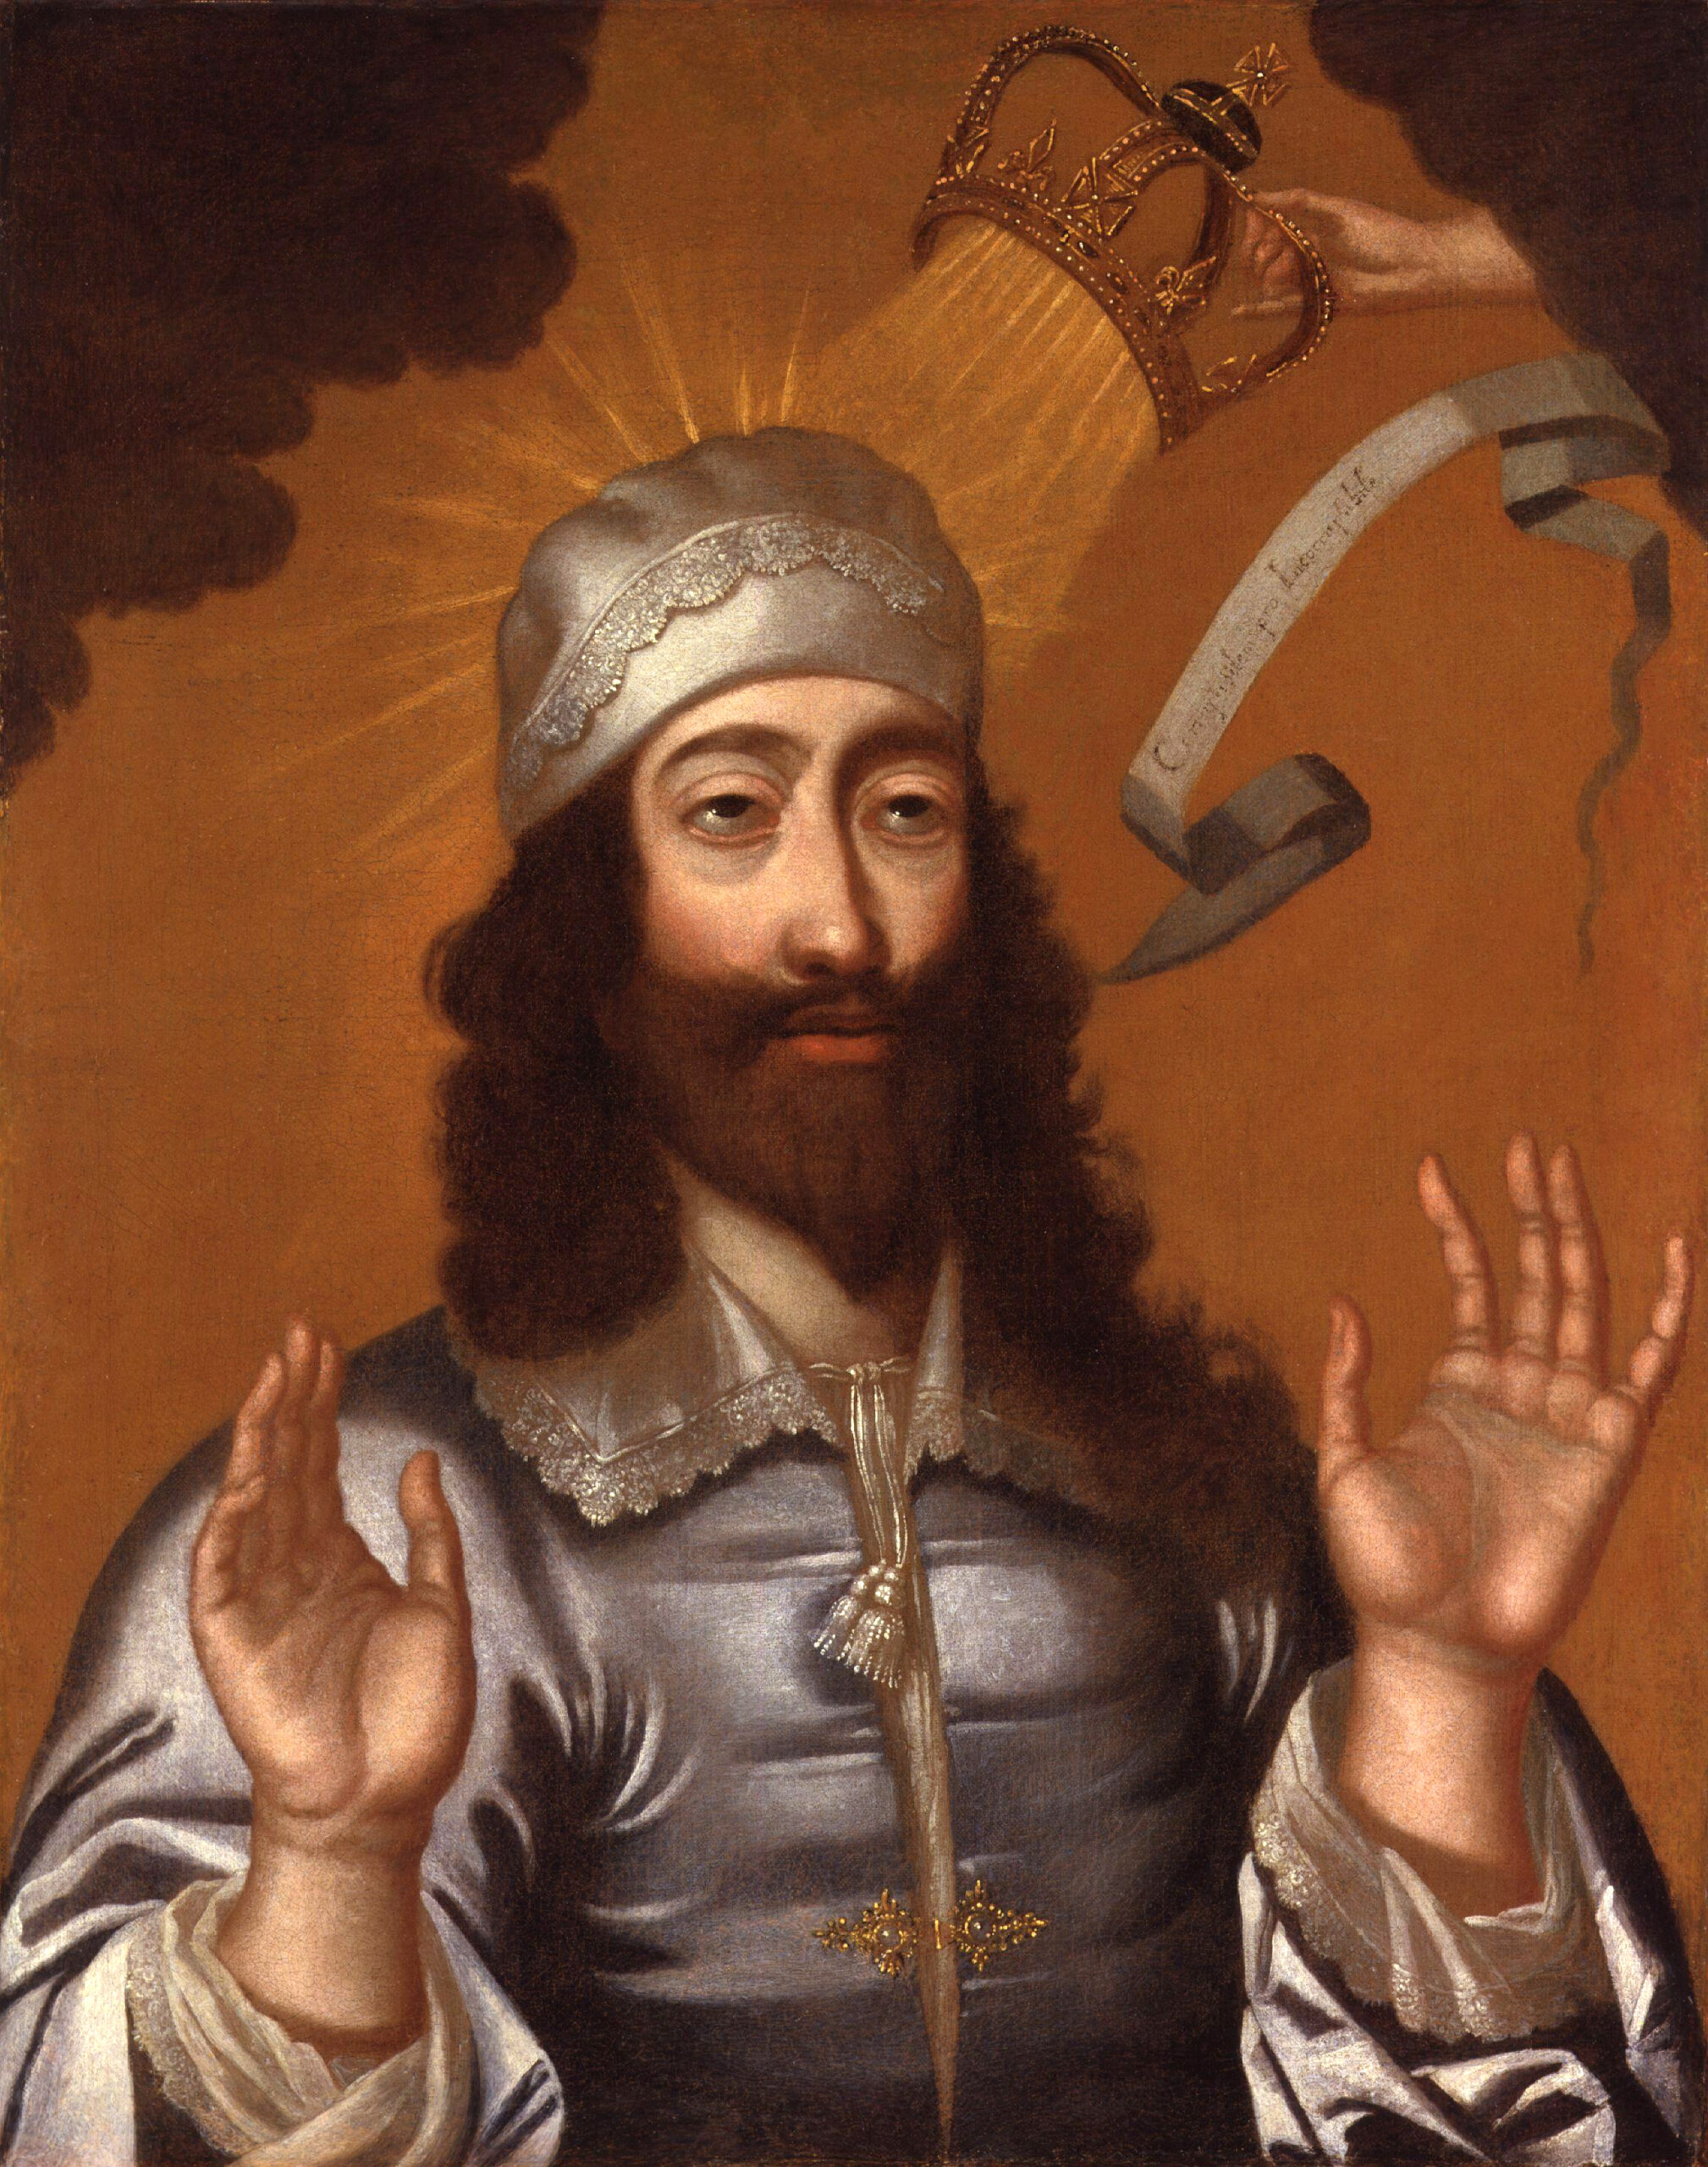
Figure 4. Charles I of England, with a divine hand moving his crown.
The processes of creating org charts are as elite-driven and political as map-making. In the war room of organizational decision-making there is no place for middle managers and front-line operators; most often, the hierarchy is charted in closed-door conversations between a select few executives and consultants. This setting lends consultants unusual authority in strategic decision making. Consultants are both navigators and the cartographers of the business, drawing boxes as they see them, or more often, as executives want them—tracing functionally necessary and politically consequential power lines on official stationery. In that sense, the way that consultants lead the re-org process is akin to a ritualistic ceremony of conferring and authorizing this power in a business – making the epithet of consultants as “high priests” particularly apt. When these charts are finalized, implemented in HR systems, and distributed to employees, they legitimate authority as a priest would a king.
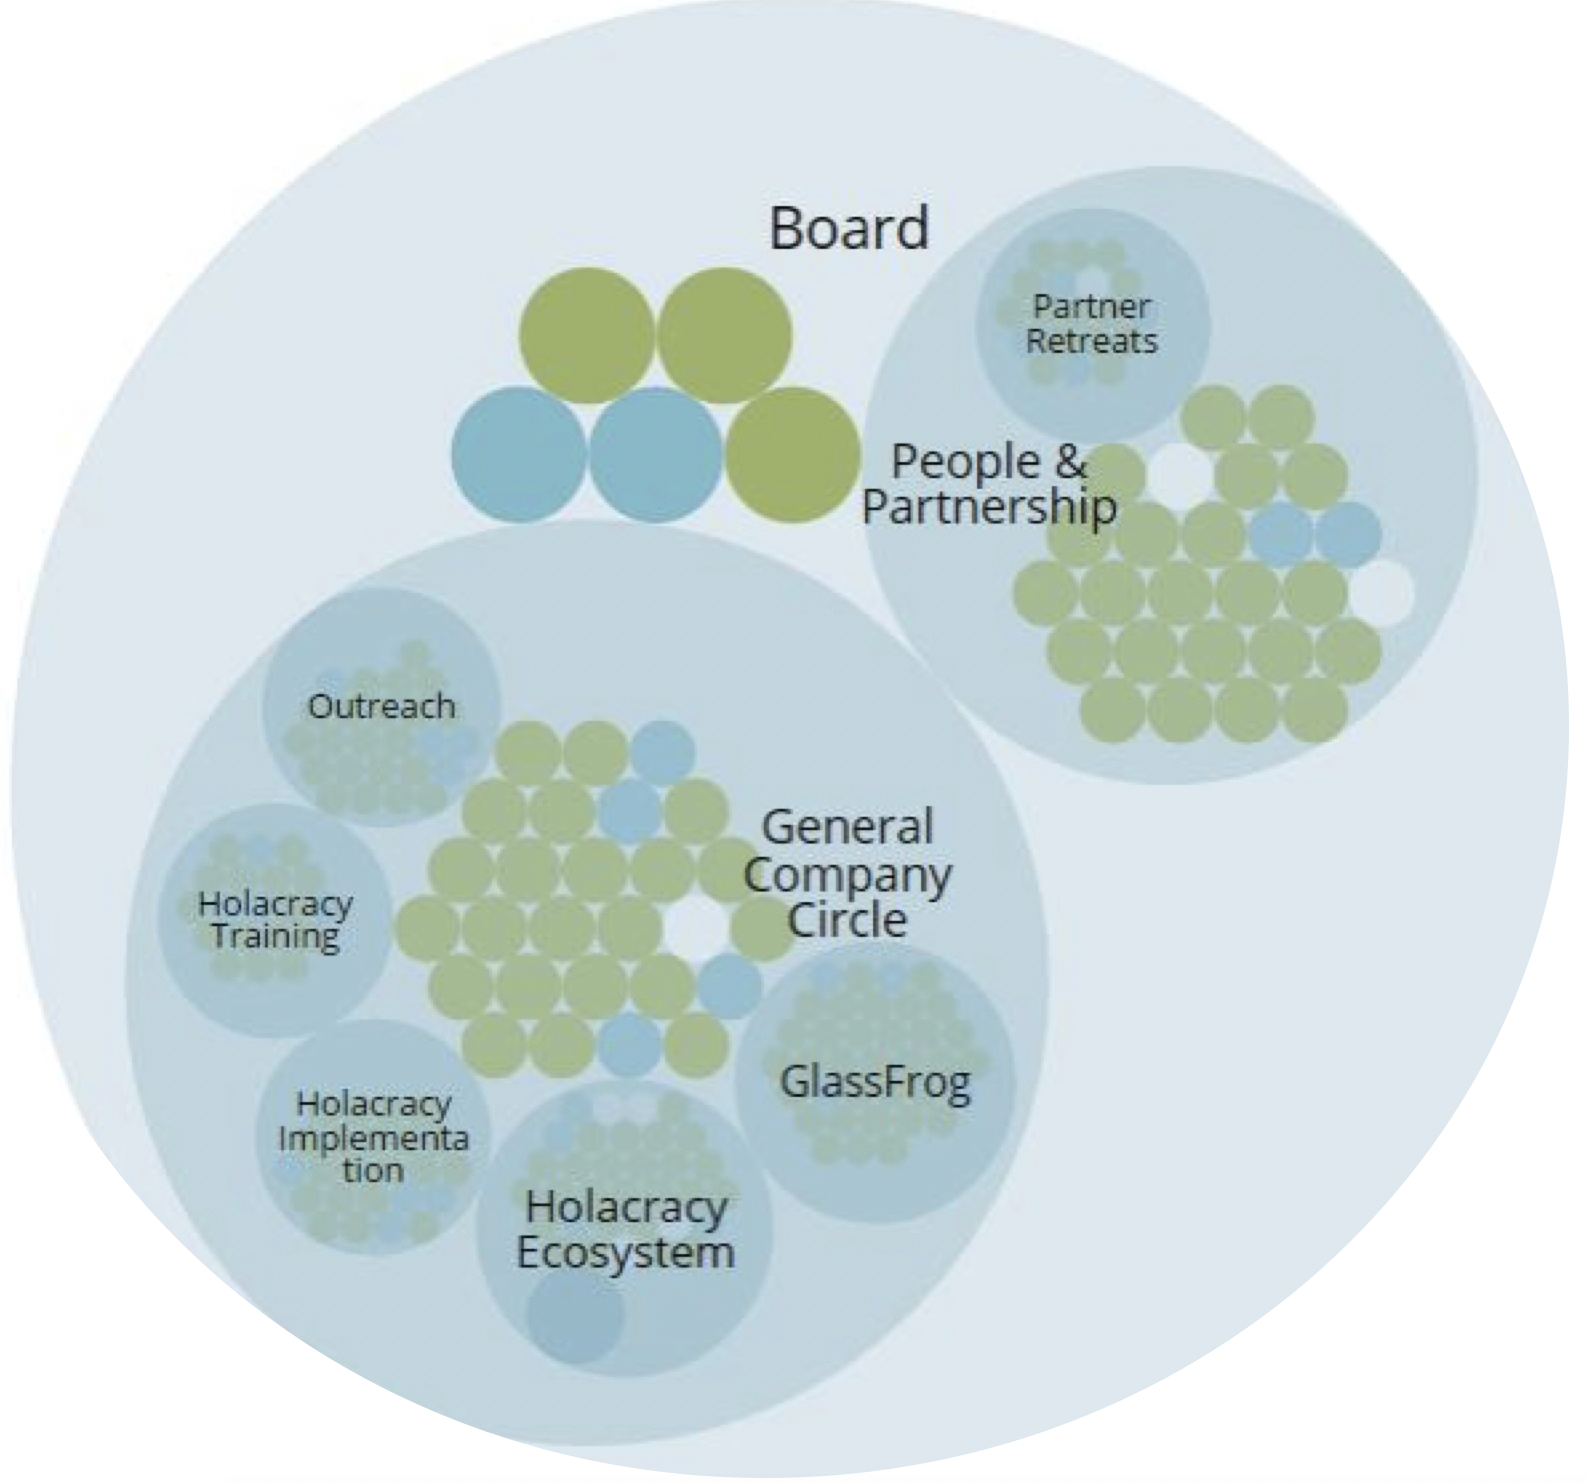
Figure 5. Holacracy model of decentralized organizational management.
Of course, org charts have evolved far beyond simple hierarchical configurations. In Matrix charts, employees can report to more than one manager and their roles may change depending on the project. Agile organizations employ a holacracy-style model, representing the organization as overlapping circles, to signal their flexibility and creativity.4 But these too express the subjunctive. By drawing the map without boxes and lines, these organizations hope to imagine into existence a hierarchy-free business environment – even as compensation, experience and skill differentials ensure a different reality.
The org chart has enduring power among organizations and consulting firms. Though its pragmatic utility remains undisputed, it has a strong symbolic function – it legitimates authority and brings power into being in deeply political ways. The task of the organizing executive or consultant, then, is to eschew the imperialistic tendencies of the cartographer, and to recognize an organization for its inherent nature – a complex web of culture and dependencies not easily squeezed into boxes and lines. To do so, consultants should instead take their cues from anthropologists and other social scientists, who not only recognize existing power hierarchies but creatively work to incorporate voices on the ground. This is no different from the consultant’s original value proposition, which is to challenge CEO’s by providing empirical evidence. Accordingly, the successful org process should be one that reveals, rather than simply mandates, the hierarchical needs of a firm, and empowers its employees towards newly productive relationships and activities.
Notes
1. Branch, J. (2011). Mapping the Sovereign State: Technology, Authority, and Systemic Change. International Organization 65(1), 1–36. DOI: https://doi.org/10.1017/S0020818310000299.
2. Beaulac, S. (2000). The Westphalian Legal Orthodoxy: Myth or Reality. Journal of the History of International Law 2, 148.
3. Branch, 248.
4. E.g., Wouter, A. et al., “The Five Trademarks of Agile Organizations,” McKinsey & Company Report, January 2018, https://www.mckinsey.com/business-functions/organization/our-insights/the-five-trademarks-of-agile-organizations, accessed 22 April 2020.
Images
Figure 1. New York and Erie Railroad diagram representing a plan of organization : exhibiting the division of academic duties and showing the number and class of employés engaged in each department : from the returns of September 1855.;”>http://hdl.loc.gov/loc.gmd/g3301p.ct007696, LCCN 2017586274, accessed 22 April 2020.
Figure 2. IBM Knowledge Center, Planning: Organization Tree Planning, Figure 1: Example Organization Chart, 2017. https://www.ibm.com/support/knowledgecenter/en/SSRMWJ_6.0.0.20/com.ibm.isim.doc/planning/cpt/cpt_ic_plan_orgtree_example.htm, accessed 22 April 2020.
Figure 3. IBM org chart from: “Company Org Chart: Do You Know All of These Essential Types.” Org Chart Creator, http://www.orgcharting.com/company-org-chart/, accessed 22 April 2020.
Figure 4. King Charles I, with a divine hand moving his crown. Artist unknown. National Portrait Gallery, public domain, accessed on Wikimedia Commons. 22 April 2020, https://commons.wikimedia.org/wiki/File:King_Charles_I_from_NPG.jpg.
Figure 5. Sample of a Holacracy driven Organisation (HolacracyOne on GlassFrog), 11-2016, by Brian Robertson and Co (CC BY 4.0), accessed on Wikimedia Commons, 22 April 2020, https://commons.wikimedia.org/wiki/File:Holacracy.jpg.
Related
Revitalizing Openness at Mozilla, Rina Tambo Jensen
Trajectories of Change in Global Enterprise Transformation, Jeanette Blomberg
The Corporate Gaze – Transparency and Other Corporate Visions, Christina Garsten
The Social Scientist as the CFO’s Best Friend, Alex Jinich


0 Comments