
When I was studying economics at university one of our professors introduced us to Jorge Luis Borges’s “On Exactitude in Science”, a one-paragraph story. It imagines an empire so enthralled by cartography that larger and larger maps of the place are built by successive generations until a map on the same scale as the empire is drawn. Following generations realise a map of such magnitude is cumbersome and “in the western deserts, tattered fragments of the map are still to be found, sheltering an occasional beast or beggar”.
Our professor’s point back then was that in a world where trying to see and make sense of too much is impossible, simple models to comprehend the world (and economics was built on simple models) carry immense value. Some years on from that, combining big data and thick data promises the ability to see and understand much more. Their combination can provide maps which are vast but also allow us to make sense of the landscape and people inhabiting them. This piece shows what this could look like.
A convergence of data proliferation, increases in computing power and algorithmic advances have made data science (and the ability to see and perceive more of the world) both possible and powerful.
My foundational years as an economist were in the Chief Economist’s Department at the Financial Services Authority (now split across the FCA and the Bank of England).
One of my teams was trying to understand market abuse (insider trading and manipulation) in stock markets. We would get daily tick data from the London Stock Exchange; this amounted to billions of data points over the year. In those (pre-big data analysis) days, we would run our models in our econometrics software packages, on linked-up “supercomputers”—and inevitably return to crashed systems in the morning. That was until our Chief Economist encouraged us to work with physicists who had long explored very large data sets, developing ways to filter and get to core relationships between points. We ended up using econophysics to build the stock market like a tree—every leaf a separate company, every branch a set of connected companies—and explored how this organism changed over time.
Colleagues were examining how fraud spread in firms, across tens of thousands of small entities. We were encouraged to look at models in evolutionary biology and how viruses spread.
Around the same time, we were reading David Laibson, Richard Thaler and others incorporating psychology into economics and realising that the way to fix information asymmetry problems was often not through simply providing more information, but through approaches like changing choice architecture or by making relevant information salient at the point it was most likely to affect behaviour. We started building out our behavioural science capabilities.
Not all our experiments were successful, but I learnt there are many lenses to see the world, not only the one I had been trained in.
There are many ways to see the world and how people behave. As long as an approach is rigorous, as long as a lens is clear and enriching, we should consider using it.
Some years later the financial services sector was struggling through a conduct crisis. Payment Protection Insurance (PPI) mis-selling had exposed problems at the heart of the business models of retail banking; in the following years, UK banks ended up having to provide compensation totalling more than £22bn for mis-selling costs. In parallel, rate manipulation scandals were tarring the investment banks. The Parliamentary Committee for Banking Standards, carrying the threat of converting banks into utilities, induced the formation of the Financial Services Culture Board (originally the BSB) to examine and improve the underlying cultures of banks.
How to go about doing this? Informed by the method agnosticism I had developed during my foundational years, we built a full-spectrum approach. On one end, we gathered quantitative signals and searched for patterns using data science techniques, and we gathered textual information and analysed this, using computational natural language processing methods. On the other end, we conducted ethnographic interviews and, working with academics at the LSE and City University, taught bankers how to conduct ethnography in their own environments. This autoethnography allowed us to scale up what might otherwise have been a more limited exercise, eliminated Hawthorne (observer) effects, and gave access to otherwise guarded environments. Citizen science of this form (if we can call it that), if structured well, can be illuminating.
Our quantitative exercises pointed us to topics and areas we might want to direct our qualitative explorations in. Our qualitative work led us to identify further signals our quantitative explorations might gather. Sometimes we applied mixed-methods in conjunction; by focusing rigorous grounded theory only on qualitative data emerging from areas where the quantitative signals suggested either a good environment or a bad environment (on cultural aspects of interest), we were able to get as close to regression running as we might with qualitative information. In other words, truly distinguishing between factors that differed across good and poor environments. Gillian Tett called us “anthropologists with big data”.
In one exercise, applying these mixed methods, we examined how environments which led to negative impacts on health and wellbeing differed from those that did not cause such material negative consequences. We found people in both types of environments in almost equal proportions talked about excessive workloads, and both in almost equal proportions mentioned the existence of organisational programmes intended to support wellbeing. The most significant differentiating factor that emerged was organisational justice. Environments that led to negative wellbeing were also deeply unfair places.
Finally, to test what worked or not in terms of interventions and possible solutions to address what we were observing through our investigative exercises (both quantitative and qualitative), we set up a behavioural science unit to run trials inside banks.
If we successfully combine big data with thick data, we start understanding the world better, and therefore finding better answers. The real promise here is the ability to see the world both at scale and in-depth.
Which brings us circuitously to our current big challenge. At Stripe Partners our mission is to help technology-led businesses invent better futures; how do (or might) we do this through combining social science and data science? This is obviously a large question, one which could have many winding answers; we will focus narrowly here on two lines of thought.
First, a foundational question: how might we think about what people say and what they do, and the difference in (for the lack of a better description) truth inherent in these distinct sources of data?
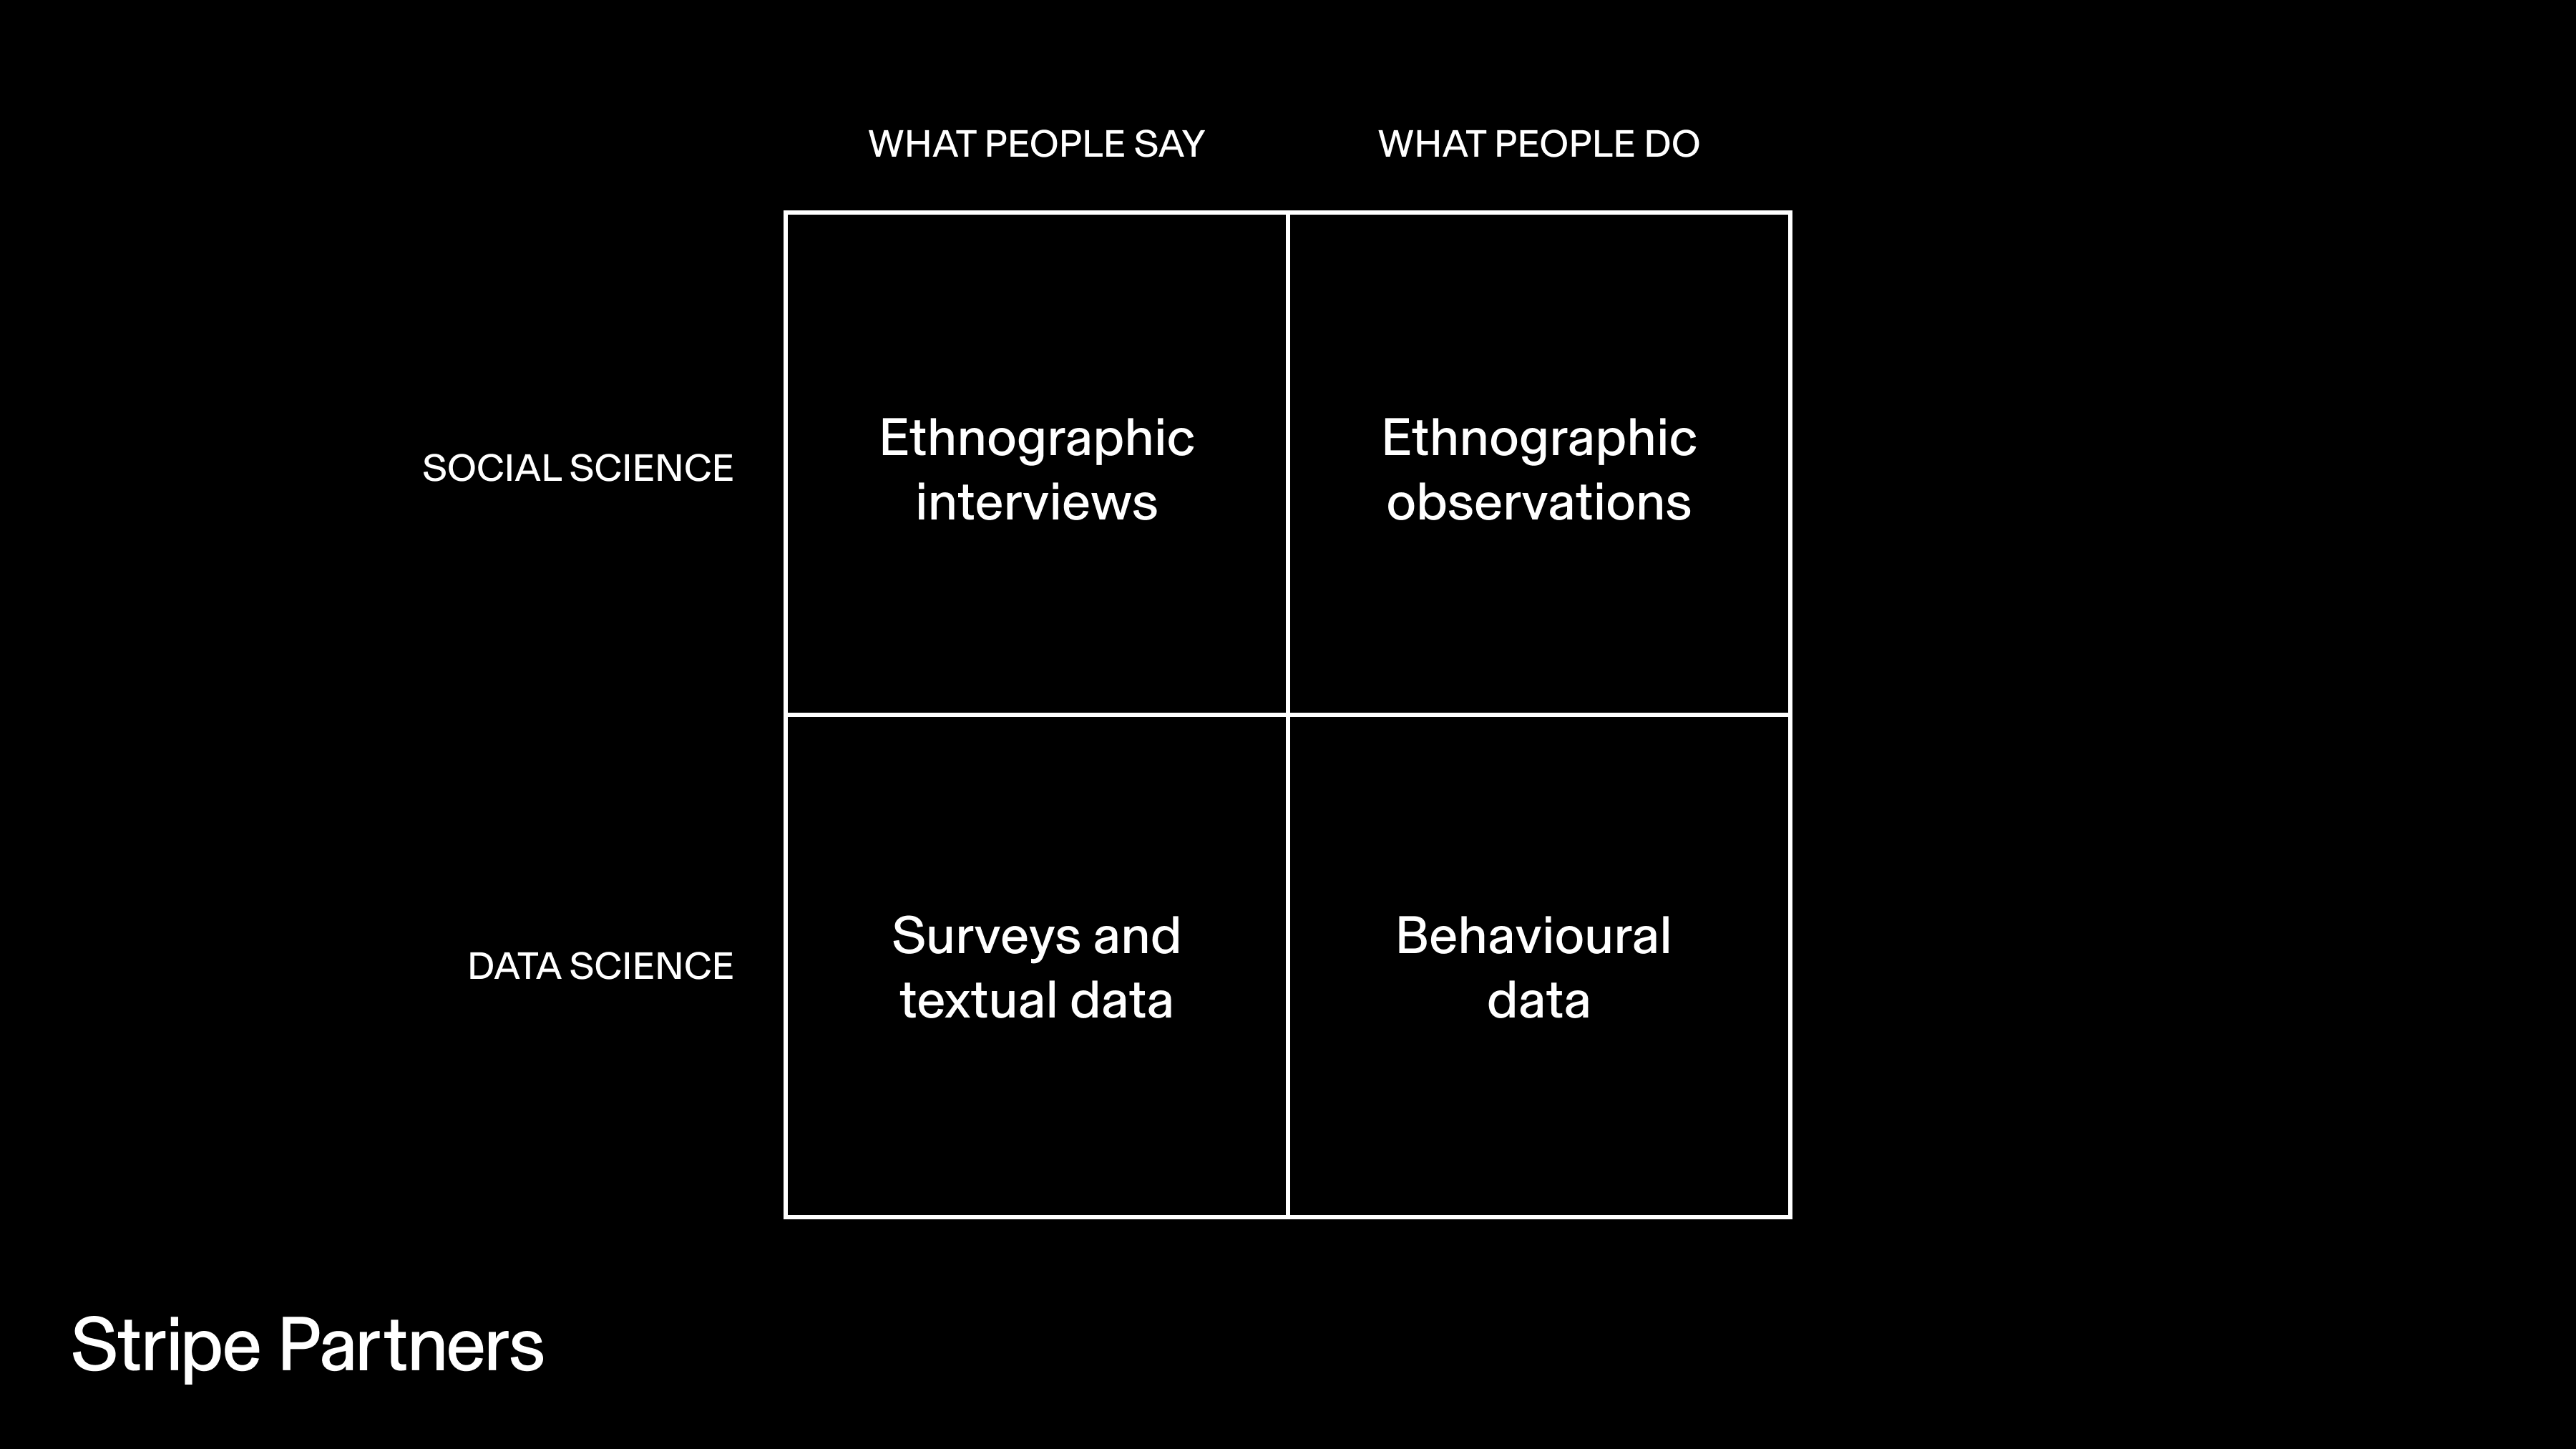
Both social science and data science, in distinct ways, can get to both what people say and what they do. Ethnographic interviews rely in a significant way on what people say, ethnographic observations on what they do. Analysed together, they offer insight into the social nature of meaning and behaviour. And on the quantitative end, surveys elicit what people say, and the wealth of behavioural data that firms now gather—what they do.
Those trained in economics are taught to rely more on revealed preferences, observing behaviour. Why? Because people might not reveal the exact truth in what they say (for example, due to social desirability bias). Or they might be poor judges of their own capabilities (for example, people on average, largely overestimate how ethical they are relative to others). Or have flawed estimates of how they might act in certain situations (experiments, for example, reveal the stark difference between how people think they might react in response to harassment and how they actually react).
But we also know (and more so now) that people often make choices in the moment that are inconsistent with what they actually want. People can choose myopically, they can overconsume (a behaviour that is common on social media platforms). To understand what users want we can’t then just rely completely on what users do either.
Separately, what we might gather from behavioral data (how people act now) might not be informative of what they might do in the future in response to a different environment or different innovation. We can imagine worlds where deep surveillance mechanisms reveal people’s motivations, but perhaps it is better we do not imagine such intrusive futures.
And from an ethnographic perspective, because preferences, motivations, behaviors, and meaning are social phenomena that don’t live/exist solely within any one individual, it’s not a truth that sits in one place an individual can fully “access”.
This is not meant to be a criticism of all forms of data, instead a statement that we operate in a world with imperfect data, imperfect signals. How should we navigate this? We think: 1) by being strongly aware and thoughtful of the shortcomings in different sources; and 2) by combining social science and data science approaches, to have the highest likelihood of addressing both scale and depth elements, while getting close to the truth through what is in effect triangulation.
By exploring what people say, we can understand their desires and aspirations. By observing what people do we can understand revealed preferences and behaviour with real-world constraints. The combination can produce deep, actionable insights based on a closer approximation of truth.
Second, the ability of machines to categorise and understand written language, to understand the context of what is written, and to creatively produce text on specific topics in specific styles has increased exponentially in recent times. Which leads us to the possibility of insightful computational grounded theory; or more productively a combination of computational grounded theory and human layers of analysis.
Ethnographic interviews produce reams of transcripts, which are impossible for researchers to fully analyse given the time constraints of typical corporate projects, resulting in concerns about consistency and rigour in research. The traditional solution for consistency and rigour is to conduct painstaking human coding and grounded theory. The time and cost implications of these solutions are high. Rapid advances in Natural Language Processing (NLP) enable us to augment human-based grounded theory analysis with computers.
Coding and grounded theory processes are interpretive and iterative, and computational methods cannot replace researcher analysis. However, by building a complimentary computational grounded theory approach we should be able to reduce biases and increase speed across the range of transcripts we generate in our work. And by applying this form of analysis to other external forms of written data we should be able to gain signals of interest from the wider world. This allows us to understand at scale (and yet in a highly nuanced manner) how cultures might be changing, how people’s needs or concerns might be moving, how people might be adapting to and using newer technologies.
Machines’ ability to categorise and understand patterns in the context of language/text has improved greatly in recent times; this appears to be a tipping point moment, allowing us to build computational grounded theory approaches which complement researcher analysis—in effect big data anthropology.
When we think about the integration of social science and data science, there are many other conceptual questions to consider, and many other ways of integration that can be thought of. In essence, the possibilities we open up here aim for faster and more agile processes than traditional solutions, and clearer pictures and maps of the world, leading in the end to better informed decisions. An inversion in some way of Borges’s story where instead of tattered fragments of maps, a new type of cartography flourishes.
Stripe Partners is an EPIC2022 Sponsor. Sponsor support enables our unique annual conference program that is curated by independent committees and invites diverse, critical perspectives.
References
Tett, Gillian. (2018, August 28). Gillian Tett asks if banking culture has really changed (Video). Financial Times.
Thaler, Richard H., Sunstein, Cass R, Nudge: Improving Decisions on Health, Wealth, and Happiness. New Haven, CT: Yale University Press, 2008.
Xavier Gabaix, David Laibson, Shrouded Attributes, Consumer Myopia, and Information Suppression in Competitive Markets, The Quarterly Journal of Economics, Volume 121, Issue 2, May 2006, Pages 505–5
Related
Anticipating the Unanticipated: Ethnography and Crisis Response in the Public Sector, Christina Cheadle & Hannah Pattinson
Beyond User Needs: A Meaning-Oriented Approach to Recommender Systems, Iveta Hajdakova et al
My AI versus The Company AI: How Knowledge Workers Conceptualize Forms of AI Assistance in the Workplace, Nanna Sandberg et al

0 Comments