
For its volume, velocity, and variety (the 3 Vs), big data has been ever more widely used for decision-making and knowledge discovery in various sectors of contemporary society. Since recently, a major challenge increasingly recognized in big data processing is the issue of data quality, or the veracity (4th V) of big data. Without addressing this critical issue, big data-driven knowledge discoveries and decision-making can be very questionable. In this paper, we propose an innovative methodological approach, an archaeological-ethnographic approach that aims to address the challenge of big data veracity and to enhance big data interpretation. We draw upon our three recent case studies of fake or noise data in different data environments. We approach big data as but another kind of human behavioral traces in human history. We call to combine ethnographic data in interpreting big data, including problematic data, in broader contexts of human behaviors.
Keywords: Big Data, Data Veracity, Human Behavioral Traces, Archaeology, Ethnography
INTRODUCTION
The digitalization of ever more things, although not truly “everything” yet, has led us into an unprecedented era of big data. For its volume, velocity, and variety (the 3 Vs), big data has been widely used for decision-making and knowledge discovery in various sectors of today’s society. However, those researchers who are more cautious or critical warn of the potential risks in the hubris or even fetishization of big data analytics (Barnes 2013; Lazer et al. 2014). A major challenge increasingly recognized in big data processing is the issue of data quality, or the veracity (4th V) of big data (Claverie-Berge 2012; Hall 2013; Lukoianova and Rubin 2014) and it is yet being heatedly debated and far from being solved by now (Geerts et al 2018). This paper proposes an innovative methodological approach to big data, an archaeological-ethnographic approach that addresses the issue of big data veracity in particular. With methodological inspirations from archaeology (Cooper and Green 2016; Jones 1997; Kintigh et al 2015; Wesson and Cottier 2014) and ethnography (Moritz 2016; Snodgrass 2015; Wang 2013) among other related fields, our proposal challenges the truth or falsity dichotomy fundamental to big data processing today and approaches big data as human behavioral traces and situational evidence for (re-)contextualized interpretation. We draw upon our three recent case studies of “corrupted” or noise data in different data environments as pilot experiments with this new approach (Ventrella et al. 2018; Zhang and Zhao 2018; Zhao et al 2018). This paper does not provide a methodic prescription ready to use for data “cleaning;” it is an invitation for epistemological redefinition of big data and methodological reformulation of big data analysis with the hope to appropriate the value (5th V) of big data in more reliable and rewarding ways.
THE COLLAPSE OF TRUE-OR-FALSE DICHOTOMY IN DATA CLEANING
We agree with a simple but crucial observation that big data are “non-standard data” generated by various sensors and digital device users (Gitelman 2013; Schroeck et al 2012). This is why that the problem of poor quality is prevalent in big data of different sources, large databases or on the Web (Saha and Srivastava 2014), or even, as some statistician suggests, that most of the data is just “noise” (Silver 2012). What makes things even worse is what some called the snowballing or butterfly effect of problematic data (Sarsfield 2011; Tee 2013): noise, uncertainties and corruption in raw data can accumulate and be amplified, and therefore compromise the value of big data in both academic and applied fields. Thus, researchers-users of big data have warned the danger of ignoring the data quality issue and urged the establishment of big data veracity before drawing interpretation (Hall 2013; Lukoianova and Rubin 2014; Schroeck et al 2012). The common practice to establish veracity has been data cleaning which simply removes data unpalatable to pregiven rules or algorithms, data described as dirty, noisy, inconsistent, uncertain, or corrupted and so on. According to recent reports, “In most data warehousing projects, data cleaning accounts for 30-80% of the development time and budget for improving the quality of the data rather than building the system” (Saha and Srivastava 2014).
Systematic approaches to data cleaning have been emerging from a range of fields, data science, linguistics, and media studies among others. In our observation, many of those converge at what we would call a context-based approach, although their specific methods and applicability vary. Pregiven data quality rules have been questioned, and context-specific strategies proposed, for example, by combining or corroborating data from multiple sources (Saha and Srivastava 2014; Schroeck et al 2012: 5). Drawing upon Paul Grice’s philosophy of language and information, Mai (2013) and others aim to build a new conceptual framework that treats information as a semiotic sign in conversational context and hence addresses information quality as situational and located in context. Building on similar theoretical ground, Emamjome (2014) promotes a new conceptualization of information quality for more context-specific models targeted at big data from social media in particular.
Since more recently, sophisticated models of context-based data cleaning have been developed especially towards automated solutions using software and algorithms (Lukoianova and Rubin 2014; Søe 2018; Storey & Song 2017). For instance, Lukoianova and Rubin reason that high quality big data is “objective, truthful, and credible (OTC),” whereas low quality big data is “subjective, deceptive and implausible (SDI)” (2014). They further argue that data objectivity-subjectivity (or OTC-SDI) variation in many ways depends on its context (Hirst, 2007; Lukoianova and Rubin 2014). They propose to quantify the levels of objectivity, truthfulness, and credibility (OTC) and thus calculate a big data veracity index by averaging OTC levels (Lukoianova and Rubin 2014). In order to assess big data quality and identify false data (e.g. rumors) in social media, Giasemidis et al use over 80 trustworthiness measures including contextual measures such as Tweet authors’ profile, past behavior, and social network connections (2016). They develop and train machine-learning classifiers over those measures to generate trustworthiness scores and then filter social media data in an automated manner (Giasemidis et al 2016).
However, in this paper, we challenge the true or false dichotomy in the methodological assumption about big data in current practice of data cleaning. Existing (proposals of) solutions to big data veracity, as discussed above, share the basic methodology of assessing data trustworthiness and then removing those data deemed as false and thus polluting. This methodology, as Søe (2018) points out, follows the ancient philosophical quest for “the truth” which we think is fair enough. However, in current practices in data cleaning, this quest is reduced to an unquestioned assumption that in big data some are simply true and thus ready for knowledge extraction and decision-making consultancy, whereas the rest simply false and only for removal. Or simply put, a true or false dichotomy (Søe 2018). In this paper, we do not take this dichotomous assumption for granted and instead we suggest to first rethink the ontological nature of data nowadays. Scholars from various fields trace the historical and linguistic origin of the concept of data (e.g., Gitelman 2013). For instance, after examining the origination of crowd-sourced geospatial big data, GIS scientists observe that the question of data quality has shifted away from the traditional survey/mapping-based concept to a more human-centric one (Flanagin and Metzger. 2008; Goodchild 2013). However, the traditional focus on truth and falsity disregards the human aspects of data, which is especially problematic in the data environment today. The connections and differences between facts, data and evidence, as delineated by historian Rosenberg in ontological and epistemological terms (2013), provide a unique perspective to reveal the inapplicability of the true or false assumption in big data veracity. Facts have to be true, because facts proven false would cease to be facts; but the existence of data is independent of any consideration of corresponding ontological truth, because “the meaning of data must always shift with argumentative strategy and context” (Rosenberg 2013: 37). With the human contextual aspects of data increasingly taken back into consideration, for example, the human intention as the key aspect in distinguishing misinformation and disinformation, the true or false dichotomy simply “collapses” (Søe 2018). Rosenberg further stresses to “make no assumptions at all about (data) veracity” in mobilizing data for our epistemological process (2013: 37). Inspired by these critical reflections, in this paper, we suggest to suspend this true or false dichotomous assumption and to treat big data as neutral materials or “evidence” signaling their sources.
TOWARDS AN ARCHAEOLOGICAL-ETHNOGRAPHIC APPROACH TO BIG DATA
Guided by methodological inspirations from anthropology, we suggest reinventing the contextual approach for the analysis of big data—including those problematic data—as neutral evidence left behind by human behaviors and situated in broader reality. Although we are no longer preoccupied with the task of judging and removing “false” data as a separate step before data analysis, that doesn’t mean we would ignore the troubling veracity issues that have been raised, falsity, uncertainty, biases, incompleteness, spikes and so on. To the contrary, we aim to confront these issues head on, rather than hoping to simply shirk them off. We do so by continuing using the contextual approach that has been evolving as introduced earlier. It has been widely recognized that these troubling issues, such as biases, are intrinsic to big data because after all, data are human creations (Crawford 2013; Gitelman 2013). Drawing upon linguistic theories, Mai (2013) and Søe (2018), as mentioned above, call to approach social media content generation as information behavior in specific conversational contexts. Also focused on social media content, Berghel (2017) argues that fake news should be examined as speech acts in bigger communicative structures and political contexts, for example the online info-wars during the Brexit and U.S. presidential campaigns in 2016. However, way before the recent outburst of interests in post truth on social media, earlier attempts had been made to adapt archaeological and ethnographic perspectives to computer-mediated communication or data, if the term big data was not as widely used yet (Brachman et al 1993; Jones 1997; Paccagnella, 1997).
Archaeological research methodology has been adopted since the 1990s to tap in to the fast accumulating digital data both online and offline. For instance, Brachman et al (1993) aim to develop a methodic system to support data archaeology that digs into digital databases, such as corporate databases, as rich sources of new and valuable knowledge. In their vision, data archaeology is an interactive exploration of knowledge that cannot be specified in advance, and doing data archaeology is an iterative process of data segmentation and analysis (Brachman et al 1993). Nolan and Levesque view the Internet as a giant data graveyard expecting forensic data archaeologists to “sift through memories for past fragments” (2005). For the practical cause of data curation, Goal (2016) promotes the data archaeology approach to recover data encoded or encrypted and data stored in obsolete formats or damaged media. Many others dig deeper into the richness of data and develop interpretive approach to data. For instance, Jones (1997) presents a theoretical outline of a cyber-archaeology approach to online data as “cyber-artifacts” generated and left behind by virtual communities in the Internet. Zimbra et al apply Jones’s cyber-archaeology approach to the study of social movement and demonstrate the potentials of this approach in “overcom(ing) many of the issues of scale and complexity facing social research in the Internet” (2010). Akoumianakis and his collaborators have been developing a more sophisticated archaeological approach to Internet-based big data for the discovery of business intelligence among other kinds of knowledge (Akoumianakis et al 2012a; Akoumianakis et al 2012b; Milolidakis et al. 2014a; Milolidakis et al. 2014b). Unsatisfied with existing data archaeology’s concentration on excavations of “semantics-oriented properties” of big data, they re-emphasize classic archaeology’s commitment in analyzing artifacts in situ so as to evoke particular understandings of the culture within which these artifacts exist (Akoumianakis et al 2012a). In other words, it is not enough to confine the analytical scope to the given semantic content of data. Now treated as digital traces, data are archaeological “evidence” of the activities of particular groups of actors and that of their community culture (Milolidakis et al. 2014a).
Archaeologists have also mobilized themselves to “embrace” big data and, in doing so, have encountered new challenges. On the one hand, the accumulation of archaeological evidence of the traditional kinds, thanks to technological advancements and other historical causes, has been building up big datasets of unprecedented volume and complexity that demands new data tools as well as new methodological strategies (Cooper and Green 2016; Kintigh et al 2015; Wesson and Cottier 2014). On the other hand, we have also seen the recent development in archaeological approach to new kinds of big data, such as online user/crowd-generated, as digital remains of human behaviors and material culture (Cooper and Green 2016; Newman 2011). Amid the recent engagement with big data as such, archaeologists reaffirm the disciplinary tradition and skills in “appreciating the broader interpretative value of ‘characterful’ archaeological data,” data that have “histories,” “flaws” and even “biases” (Cooper and Green 2016; Newman 2011; Robbins 2013). Nonetheless, in the data landscape today, the interpretive capacity of archaeology is bounded by the types of data accessible and the tools available for data extraction, analysis and synthesis (Akoumianakis et al 2012a; Kintigh et al 2015). For example, in Akoumianakis et al’s research (2012a), Youtube users’ demographics or Youtube insight data, which can be very useful and informative, are not entirely available from the Youtube Data API (Application Programming Interface). A related set of challenges is to combine online digital traces with offline activities in order to (better) reconstruct and understand the broader contexts and cultural processes (Akoumianakis et al 2012a). Therefore, facing these challenges, archaeologists call for revolutionary transformation to turn archaeology into a more integrative science which integrates data, tools and models from work in a wide range of disciplines (Cooper and Green 2016; Kintigh et al 2015).
While it is obviously beyond our job and our capability to revolutionize archaeology, we follow these archaeologists’ integrative strategy to incorporate methodological wisdoms from another subfield of anthropology—ethnographic wisdoms—into big data research. In an early attempt to adopt ethnographic methods in the study of virtual communities, sociologist Paccagnella (1997) explores the great potentials in integrating the “deep, interpretive” ethnographic research methods with new tools for collecting, organizing and analyzing voluminous online digital data. Informatics scholar Nardi has been interested in tracing Massively Multiplayer Online Role-Playing Game (MMORPG, such as World of Warcraft) playing to its offline sources and uses ethnographic methods to reestablish and understand the social-cultural settings of online gaming behavior (2010). Since recently, drawing upon experience with data collection and processing in and beyond anthropology, researchers trained in ethnographic study have been more openly critical of the fast rising practice of big data analytics (e.g. Bell 2011; Wang 2013), and many of these critiques raise fundamental questions to big data veracity (e.g. Crawford 2013; Snodgrass 2015; Moritz 2016). First, ethnographers are trained to be careful about accepting informants’ representation of themselves at face value, due to the potential of people’s misrepresentation or even deception especially in computer-mediated contexts (Snodgrass 2015). Second, “ethnographers often take a cross-cultural approach in data collection and analysis because simple words like family, marriage and household in collected data can mean different things in different contexts” (Moritz 2016), and this variation of meaning by contexts is not derived from people’s accidental misrepresentation or intended deception but is fundamental to data analysis and interpretation. However, while computational technologies record and make available massive amounts of data, much of these data are “decontextualized and free-floating behavioral traces” (Snodgrass 2015). Moreover, after all, big data are only subsets of behavioral traces left by subsets of people in the world that happen to be captured in the big data sets (Moritz 2016), therefore, however big big data are, they are incomplete and often unrepresentative.
Taking into consideration these concerns and more, “using Big Data in isolation can be problematic,” as Wang calls out in her well-read article (2013). Problematic, yet tempting. For their great abundance, read-made streams, and often numeric forms, big data are easy to access, to manipulate using automated programs, and to draw stunning conclusions. In comparison, ethnographic data are often based on a small number of cases, more in qualitative than quantitative/numeric forms, and time consuming to produce and manipulate. Moritz calls “the streetlight effect” this tendency of researchers to study what is easy to study, dubbing the well-known joke of the drunk who searches for his lost wallet at night under the streetlight (2016). There have been pioneering calls and efforts to break the problematic tendency of “using big data in isolation.” Amid the overwhelming rise of big data especially in the business world, Honig defends “small data” and calls for refocusing on “the diversity of data available” (2012). From a slightly different perspective, Burreal develops a guide for ethnographers, or the “small data people,” to understand and hopefully work with big data (2012). Wang has been a strong advocate for “Thick Data”—extending the term “Thick Description” that anthropologist Clifford Geertz (1973)used to refer to ethnographic methodology—and for the complementarity between big data and thick data (2013). Thick data, although often small in quantity, are good at this fundamental job of rebuilding the social context of and connections between data points so that researchers could uncover “the meaning behind big data visualization and analysis” (Wang 2013).
We take up the pioneering calls and efforts as introduced above and aim to develop a more integrative strategy combining archaeological and ethnographic approaches to big data in the new data landscape today. The so-called big data revolution has been widely debated—celebrated by many, and questioned by some including those on data quality and veracity issues (Barnes 2013; Honig 2012; Lazer et al. 2014; Silver 2012). We agree that it is indeed a revolution. But we take it as revolution not simply for the abundance and easy availability of data. More importantly, we take it as a new data regime that demands methodological innovation. We would not be as pessimistic to disregard most of big data as “noise” (e.g. Silver 2012). Actually, we believe it is unfair for big data to have been accused of serious veracity issues while having being embraced, celebrated, butchered and exploited. What needs to be interrogated, deconstructed, and reinvented is the mainstream methodological approach to big data, including the true-or-false dichotomous judgement and screening before data analysis. We want to reiterate this simple but fundamental observation that big data are “non-standard data” (Gitelman 2013; Schroeck et al 2012)—they are not traditional scientific data produced in chemistry labs or in geology fieldwork following established methodic principles of modern science. Data generated by users on the internet or by sensors installed in people’s life, big or small, all are raw and incomplete digital traces of people’s behavior and life in the recent past—“naturally occurring social data” as Snodgrass called (2015). Thus, big data, including the discriminated noisy or corrupted data, all can be valid and valuable resources, “cultural resources” to be more accurate (Gitelman 2013). Beyond the easily available big datasets, concerned anthropologists have called big data researchers to get out their labs and do first-hand research by “engaging with the world they aim to understand” (Moritz 2016; Snodgrass 2015). In this new data regime, we take an archaeological approach to the existence and value of big data. As discussed above, we take big data as digital traces of human behaviors and use them as archaeological evidence that should be processed and analyzed along with data from other sources, especially contextual data such as ethnographic data. We believe our innovative methodological approach has the potentials in addressing big data veracity challenge and enhancing big data interpretation.
We explore the potentials of this integrative archaeological-ethnographic approach to big data in our three recent case studies that are presented in the next sections of this paper. These case studies focus on topics and datasets from different fields, location spoofing in mobile online gaming (Zhao and Zhang 2018), fake location-based posts on social media (Zhang et al. 2018), and noise data in sensor-based monitoring of humanitarian technologies performance (Ventrella, MacCarty and Zhang 2018). Nonetheless, they draw upon largely the same methodological approach in development with a few specific methods used in slightly different ways or to different extents. The ethnographic components in the first two case studies rely primarily on virtual ethnography, or online ethnographic fieldwork including specific research activities such as online user profile collection, online post collection, online community participant observation, and online anonymous informal interviews. The ethnographic component in the third case study relies on on-site ethnographic fieldwork in rural communities in Guatemala, Honduras and Uganda including specific research activities such as participant observation, community survey and semi-structured interviews. All these ethnographic research activities were carried out by the co-authors of this paper with our local collaborators’ assistance in the third case.
CASE STUDY I: LOCATION SPOOFING IN POKÉMON GO
The worldwide surge of the Location-based game Pokémon Go since mid-2016 has raised wide debates in and beyond online gaming communities. Our study focuses on the unique phenomenon of location spoofing that has been less discussed in these debates but has critical implications in and much beyond this game. Location spoofing has been defined as “a deliberate locational inconsistency between the reported location and actual geographic location where a specific network communication is made to location-based game or other kinds of Internet applications” (Zhao and Sui 2017). Location spoofing has been often simplely considered as generating fake locational data and cheating in gaming. Overall, there is yet rather limited understanding of user-generated spatial data from location spoofing, compared to the well-examined systematic error, outliers, and uncertainty in spatial data. To fill this gap, our study approaches to this proliferating phenomenon as a unique case to engage the fundamental issue of data veracity or quality in the era of big data today. In order to understand the motivations and grasp the associated contexts of location spoofing, we conducted empirical research combining different kinds of data. We collected a big data set of Pokémon Go from the database Pokémapper.co that is the largest one of this kind and the most acknowledged by the Pokémon Go players community. Databases as such are crowdsourced timely by individual players: once a wild Pokémon is sighted, the player voluntarily reports this new finding to the database. Using the API of Pokémapper.co, we collected a dataset of 77,445 Pokémon records on October 21, 2016. These Pokémons were sighted by players from July 10 to October 21, 2016. Beyond that, we also acquired substantial contextual information about the game by being an observing participant in this game and discussing gaming experience with local and online fellow players. In addition, we also used demographic data of New York City and geographic information of downtown Tokyo to contextualize the geographic distribution of Pokémon resources.
Location-based game (Wetzel, Blum, and Oppermann 2012) is a type of digital game in which the physical location of a player in the real world is set to be identical to the location of the player’s avatar in the virtual space of the game. Since such game is installed and played in mobile devices, most commonly smartphones, tablet, wearable devices, the physical location of a player can be determined through the positioning system of the mobile device that the player carries. The positioning system in most mobile devices as such can read a series of radio frequencies, including GPS, cellular, crowdsourced WiFi, and possible others (Sommers and Barford 2012). In Pokémon Go, players can locate, catch, train, and level up a virtual creature, called Pokémon, in the game space and, at the same time, projected to the real world. In this way, Pokémon Go merges the real world and the game frame via player’s location (Ejsing-Duun 2011; Rao and Minakakis 2003). Reported by yet few observations and discussions, it is not uncommon for players to conduct location spoofing in this game for various purposes, to name a few, downloading the game app, participating in remote battles, catching rarer Pokémons, or levelling up Pokémons (Alavesa et al. 2016; Lee and Lim 2017; Martins et al. 2017; Wang 2017). A few location spoofing techniques or tools have been used, including GPS spoofing apps, VPN spoofing, drones, and dogs. Among these tools, GPS spoofing apps might be the most economic, powerful and popular one. A GPS spoofing app can take over the GPS chipset of a mobile device and report a designated location instead of the real one. By this means, players can virtually visit anywhere as they personally desire and digitally designate. Usually, a GPS spoofing app as such is free or inexpensive, and can be downloaded from Apple Appstore or Google Play Store. This technique of location spoofing enables gamers to engage in remote activities by using simulated, or “falsified”, locational information without the gamers physically being out there. Therefore, location spoofing has been largely considered, or rather condemned, as a threat to the underlining fairness of the game and thus to the social order of both online gaming communities and the real world. We argue that the various involved actors—the game players (including spoofers of course), the game company, spoofing bots/apps, drones and dogs, create a new and evolving spatial assemblage and we call it a hybrid space (Althoff, White, and Horvitz 2016; LeBlanc and Chaput 2016).
The spatial distribution of Pokémon resources displays unique patterns and suggests social-economic differentiation. We overlay New York City map with the spots of sighted Pokémons (as from the Pokémapper.co database). The resulted maps (see Figure 4 in Zhao and Zhang 2018) show that most Pokémons clustered at main parks, such as Central Park and Marcus Garvey Park, and famous landmarks such as World Trade Center and Time Square, whereas only few scattered around the suburban areas. This contrastingly uneven distribution of Pokémons makes the game unplayable in suburban and rural areas, as many players reported and an earlier research on Pokémon Go also observed (Colley et al. 2017). We also aggregated choropleth maps of Manhattan with census tracts. These maps indicates that Pokémons are more likely to appear in the neighborhoods with a larger share of white residents (mainly in southern and central Manhattan) than in black neighborhoods (mainly in Northern Manhattan) (see more details in Figure 4 in Zhao and Zhang 2018). This race or ethnicity difference was also found in other cities such as Chicago (Colley et al. 2017). In an even finer scale, we also examined the distribution of Pokémon Go game facilities, such as PokéStops (where players can recharge new times) or gyms (where teams of players battle with each other). These facilities were set up at local businesses as a marketing strategy to lure foot traffic and stimulate local consumptions. With McDonald’s as a major sponsor of Pokémon Go in Japan, Pokémon Go has converted local stores of McDonald’s into PokéStops or gyms (Yang and Wenxia 2017). To corroborate this strategic association in media report, we count the number of McDonald’s local stores converted into gyms in the Chiyoda Ku (aka County) of Tokyo. We found all the McDonald’s local stores on Google Map, and then labelled those gyms using Pokémon-radar.net (another online database showing the locations of sighted Pokémons, PokéStops and gyms). As a result, there were 18 McDonald’s local stores in Chiyoda, among which 10 were gyms (see Figure 5 in Zhao and Zhang 2018). Obviously, it is a shrewd strategy to turn McDonald’s in the real world into Pokémon gyms in the hybrid space, and it also contributes to the uneven distribution of game resources.
It is in this context of the uneven distribution of Pokémons and game facilities in the hybrid space, we further examine the players’ gaming behavior, especially the motivations behind their action of location spoofing. To help players overcome the geographic limitations, Pokémon Go actually offers an alternative option that is buying Pokécoins. Players can buy and use Pokécoins to avoid or reduce the trouble of moving around for capturing and training Pokémons. However, Pokécoins cost real money; and not every player is able to afford or willing to invest. Opposite to its supposed aim of helping players to overcome the uneven distribution of Pokémon resources, Pokécoins have turned out to be another socio-economic mechanism of unequal accessibility and thus aggravated t many players’ frustration. Therefore, players have been motivated in multiple ways to manipulate their locational information with various spoofing techniques. For most location spoofing players, their motivation lies in the satisfaction of catching more valuable Pokémons and competing with others in a more time-efficient way. For others including those who are also hackers and inventors of location spoofing bots/apps, they gain especially strong intellectual and emotional satisfaction from their newly developed spoofing techniques to challenge the game rules and even to resist the social-economic inequality and unjustness that they perceived in this game. Our investigation and interpretation thus far advances the understanding of people’s gaming behaviors and potentially informs the design, delivery and marketing strategies in the gaming industry.
Our contextualized analysis of location spoofing in this study demonstrates how the human factors—behavioral, social, economic, and emotional among others—give shape to the big data sets that are eventually available for people to conveniently access and use. In this study, we do not make any moral judgement on Pokémon Go players’ location spoofing behaviors; nor do we deny or disregard the “falsified” locational data generated through location spoofing behaviors. We take a neutral methodological approach to data inconsistency as in spoofed locational data in this case. Instead of rushing to judge spoofing behaviors as moral or not, we acknowledge the factuality in spoofed or “falsified” data and reveal the rich meanings and underlining logics in inconsistent (and inconvenient) data. By doing so, we advocate for the methodological importance of falsified or corrupted data that often get discarded in data cleaning. We argue that data cleaning by simply screening and ridding inconvenient data runs the risks of losing valuable components of big data sets and threating the integrity of the entire data sets. This case study is meant to be an exploratory and demonstrative experiment with our new approach to big data, including spoofed or “falsified” data, as real data in the sense that they are digital traces of real human behaviors embedded in broad social contexts. It also suggests that big data should not be taken at face value, as their rich values lie in, and thus can only be appropriated in, the social-technological contexts in which the specific big data sets are generated.
CASE STUDY II: FAKE LOCATIONAL DATA IN SOCIAL MEDIA
While big data generated by internet users have been unanimously celebrated and increasingly drawn upon in and beyond both the academia and the high-tech industries for over a decade by now, “post truth” has seemed to strike us by surprise since 2016 especially in social media and been univocally condemned as some blasphemy to today’s digital age. Our second case study seeks to engage the ongoing debates surrounding post truth by examining a collective cyber-protest movement on location-based social media. In late 2016, with the hope to support the local protests against an oil pipeline in construction to pass through the region, tens thousands of Facebook users from worldwide locationally identified themselves to the Indian reservation at Standing Rock, North Dakota using location-based features, mainly check-in and location review. As a result, this online protest movement generated massive volume of fake locational information. In this study, we examine both the locational data and textual content of the “fake” check-ins and location reviews as digital traces of online protests. We reveal the geographical distribution of Facebook protestors and the social-technological network of the involved actors (including Facebook recommendation algorithms) as broader contexts for the interpretation of the fake locational data. This study demonstrates our effort to develop a contextualized approach to the discovering and understanding of fake locational data and broadly post truth in online environments today. This study also combines multiple methods of data collection and analysis and uses data of multiple forms and sources. We built a python program to collect and geocode the check-in and location review posts (the ones made accessible to the public) and then store them in a MongoDB database. Additional information collected and used comes from online and traditional news media, the pipeline company, and government agencies. Moreover, we also conducted a few interviews online and offline with Facebook users who participated in the online protest.
The Dakota Access Pipeline (DAPL) is an underground crude oil pipeline built from June 2016 to April 2017 passing right next to the Standing Rock Indian Reservation. DAPL was strongly opposed by environmental activists and local Native Americans. They deeply worried about the future risks that the local water supplies would be polluted and that the spiritual space of the natives irredeemably stained. Therefore, they had swarmed into Standing Rock and formed several protest camps near the planned DAPL route since early 2016. The on-site protest soon expanded to the cyberspace with sympathizers and participants worldwide, known by the hashtag #NoDAPL in popular social media especially Facebook and Twitter. Our study focuses on the geolocational information streams in this online protest movement (referred to as “the #NoDAPL Movement” henceforth), especially during its peak time at the end of October 2016. Starting from October 30, 2016, a large number of Facebook users expressed their concerns with the pipeline and their supports to this protest in the form of online posts, mainly check-ins to and location reviews of Standing Rock. By the afternoon of October 31, 2016, the number of check-ins went viral from 140,000 to more than 870,000 (Levin and Woolf 2018). Moreover, we also captured 11,915 reviews (out of the approximately 16,000 reviews in total) posted on the profile page of Standing Rock. As clearly stated in many of these posts, most of the Facebook check-in participants and location review authors did these posts without physically being at Standing Rock. Nonetheless, their posts consequentially generated inconsistent locational information in Facebook datasets.
Our mixed-method analysis traces the geographic origin and social formation of the Facebook users’ reveals the motivations of the remote check-ins and location reviews. As shown by the time series (see Figure 3 in Zhang et al. 2018), over 99% of the location review posts were posted during the two days of October 30th to 31st, 2016. After geocoding these reviews, we plot the global distribution of the Facebook reviewers of Standing Rock (see Figure 5 in Zhang et al. 2018) and found most of the reviewers were not physically located there around those days. People outside the U.S. also joined the protests both online and offline, and turned the #NoDAPL movement into a global issue. Overall, social media not only gave people the platform to project their concerns and feelings, but also became the virtual bridge connecting geographically disconnected people into a global network of collective actions both online and offline. Initial qualitative analysis of these posts reveals the primary themes and motivations of these posts, including the fact of no physical presence behind most these posts. A word cloud (see Figure 4 in Zhang et al 2018) gives a basic overview of some main terms appearing in check-in and review posts. The high frequency or popularity of key words like “hope”, “love”, “peace”, “human”, “water”, “solidarity” shows the major sentiments around this online movement. Words like “calling”, “people”, “EVERYONE”, “join”, and “share” reveal the grassroots feature of this social media movement. Not as popular but no less important key words like “defeating”, “deceived” reveal one of the main motivations behind many of these posts, that is to confuse and overwhelm the police system with their fake check-ins.
Further analysis of the post content, combined with interview data, identifies four major types of participations in the #NoDAPL movement. The first is derived from the popular belief that the local police department and their intelligence program was screening through Facebook’s locational data sets to compile a list of protesters and track them down. Therefore, as mentioned above, fake check-ins were meant to collectively flood a stream of potential intelligence for police with voluminous false information, and thus to confuse the police about the number and identity of those actually protesting on site. However, more participants in the #NoDAPL movement did not believe that the police was using Facebook data to track protestors or that they would be able to confuse the police with their fake check-ins even the police was doing so. With that in mind, most of the #NoDAPL movement participants were simply demonstrating their moral and political supports to the on-site protest without the intention to create false locational data or to confuse anyone. Remote check-in, or technically fake check-in, turned out to be a very convenient and highly visible way for them to show their support by virtually “standing” with Standing Rock. Examining the textual content of these posts, we found many Facebook participants were fully honest about their action of online protest through “fake” check-ins. For example, one participant said, “We can’t all be at Standing Rock, but we can check in as being there.” In thousands of circulated fake check-in posts, the authors clearly stated their stance and motivation as such using similar, if not as succinct, phrases. Third, many Facebook users checked in to or reviewed Standing Rock without clear aims though. After seeing friends’ posts or randomly recommended posts indicating an ongoing trend, they simply followed the trend by some harm-free mouse clicks. We can tell this from their posts saying “confused”, “not sure”, “don’t know”, “because of the beautiful videos of Standing Rock”. Many did not really know what was going on, but still took action out of social media network peer pressure (Cho, Myers, and Leskovec 2011; Seidman 2013) as getting involved with the social network interaction. Nonetheless, their participation did consequentially add to the momentum of the movement, the public pressure on the pipeline project, and the amount of fake locational information. Forth, some other Facebook users “joined” the #NoDAPL movement, but the contents of their posts are completely unrelated to the Standing Rock issue except using the trendy hashtags such as #NoDAPL. They incorporated these trendy hashtags only to increase the visibility of their topically unrelated posts by taking advantage of Facebook’s recommendation algorithms. Such participation is not irrelevant to the movement or to our research interest here though; the increased use of the trendy hashtags as such algorithmically amplified the popularity of these hashtags and thus enhanced the visibility and influence of the #NoDAPL movement. These four main kinds of participation were confirmed with responses from our interviews with online protesters.
This case study suggests four tentative arguments. First, our analysis of the fake locational data and the motivations in generating these data poses fundamental challenges to the morally charged description of remote check-ins and reviews as deception or cheating. The second and third types of participations in the #NoDAPL movement described above did not have any intention to deceive anyone. The first and forth types meant to deceive or confuse the police system’s data processing programs and the Facebook recommendation algorithms, but not other social media users who would see and read their posts with human eyes. Second, this study provides a unique case of new mode of information generation and diffusion by ordinary people, or namely used- or crowd-generated. In existing works including non-academic debates on post truth and fake news, ordinary people are unanimously treated as passive recipients and consumers of information produced by politicians and mass media. We challenge this elitist approach, and we see ordinary people as actors or agents in information creation and dissemination as well, if not equally powerful. As our case study reveals, fake information could be strategically created by ordinary people and turn out to be bottom-up challenges to or even manipulations of political or technological authorities. Third, our focus on the fake locational data proves once again the rich values and methodological significance of the supposed untrue and unuseful data in big data sets. Our contextualized analysis of data generated by these remote check-ins and reviews provokes us to rethink the true-or-false dichotomy assumed in the currently mainstream practice of data cleaning. In this case, there are obviously inconsistent (locational) data. But among them, only some were intended to be false and deceiving, others not; moreover, those were intended to be false and deceiving only to computerized programs and algorithms, not to human individuals, as in the first and forth motivations described above. New data environments like this are forcing us to rethink our definition of true and false data and to reformulate our methodological approach to big data veracity. Forth, this case study brings forward a unique pattern of interaction between social media users and recommendation algorithms. Many of the involved Facebook users wanted to confuse the police system’s locational data screening programs and Facebook’s recommendation algorithms, or even more proactively to take advantage of the recommendation algorithms (by using the popular hashtags) to promote their posts and their agenda which were not necessarily related to the protests. Based on this study, we suggest rethinking towards human centered design of algorithms in a new data landscape. Although as non-human actors, algorithms play vital role in the network of social interactions of human beings. In this location spoofing case, the recommendation algorithm, as an invisible function, shaped people’s activities. Because of the bias-based preference, social media users are possibly feasted with news illusion. Mainly in response to the phenomena of post-truth, Facebook has recently been testing filtering algorithms to detect and reduce misinformation in the big data generated through social media. Based on this case study, we would point out that social media users have challenged the use of algorithms and call for the integration of human dimensions in algorithm design.
CASE STUDY III: SPIKES IN SENSOR-BASED DATA
This case study is a methodological reflection upon our development of a sensor-based monitoring system and our interpretation of data recorded by this system in the field of development or humanitarian technologies. It experiments with our integrative methodological approach to sensor-based raw data as digital recordings of human behaviors embedded in specific environmental, social and cultural contexts. We report the challenges in traditional automated approach to data cleaning using algorithms and the benefits from contextual ethnographic data for more informed data processing and more accurate data interpretation. Specifically, this case study focuses on the design and testing of a novel sensor system invented to measure the fuel consumption and cookstove use of people in low-income countries, specifically Guatemala, Honduras and Uganda by now in this project. Since its initial stage, this sensor system project employs an integrative or mixed method approach, incorporating ethnographic methods for both sensor system design and sensor data interpretation. This project has harvested 24-hour data from over a hundred sensors in the summers of 2017 and 2018 and it is planned to multiply the sensor installation and the data harvest in the following years. The ethnographic methods used in this study include community meetings, participant observation, informal interviews, focal follow, and semi-structured surveys conducted all on site by our co-author Ventrella, her OSU engineering lab collaborators and local assistants. The ethnographic data turn out to be essential especially in (re-)contextualizing and interpreting spikes and noises in the sensor-recorded data sets. This case study demonstrates how our integrative methodological approach to big data avoids uninformed removal of data outliers and associated misinterpretation of data sets. In other words, this methodological approach helps to maximize the values of sensor-based big data for the design and performance of development technologies. This leads to our suggestion of data diversity and our discussion on less costly data saturation in and beyond the industry of global development.
Today 40% of the global population continues to rely on traditional open fires for cooking and heating (Bonjour et al 2013). To mitigate the harmful health and environmental impacts of this common practice, engineers have designed improved cookstoves with a variety of fuel types to increase the efficiency of heat transfer and combustion. However, adoption and performance of these devices have been found to vary greatly, depending on the design and its ability to meet user requirements. Stakeholders in this new field of development or humanitarian engineering, including academic researchers, non-government organizations (NGOs), funding organizations, climate financing institutions and energy technology industries, have called for better monitoring tools to quantify the adoption and technical performance of these devices. To meet this need, a group of researchers at Oregon State University, including our co-authors, developed the Fuel, Usage and Emissions Logger (FUEL) system, an integrated logging load cell and temperature sensor that measures fuel consumption and cookstove usage in households and schools. Since its very beginning, this project adopted a mixed-method ethnographic approach to understand user context, build empathy, and inform the design process.
Post-analysis of the initial observational data showed the central importance of fuel in both the cooking process and as an indicator of multiple metrics of cookstove performance, which in turn inspired the concept of logging fuel weight. Upon evaluation, it was decided that the logging load cell to weigh a household fuel supply was most likely to meet stakeholder requirements, be technically feasible, and measure the most indicators. It was hypothesized that a logging load cell could be used to determine: (i) the frequency of fuel collection events and amount of fuel collected per event, (ii) fuel consumption per cooking event, (iii) duration of cooking events and number of events, with temperature as a backup measure, (iv) emissions. It was also hypothesized that the fuel holder could: (v) be connected to the load cell could be operated in tension or compression, (vi) double as a carrier during fuelwood collection. After choosing the initial concept of a load cell to measure the indicators of stove performance, the system components were designed. The initial prototype system including the load cell, electronics, thermocouple and carrier is shown in Figure 1 below (see also in Figure 3 in Ventrella, MacCarty and Zhang 2018). a) Fuel weight measurement and storage: A load cell that could accommodate up to 50 kg of fuel was selected. b) Temperature measurement: A thermocouple port was chosen to be flexible in length and accommodate high temperatures. c) Electronics, Data Storage & Transmission: Circuitry design and manufacturing was outsourced to Waltech Systems, a small company in rural Oregon that specializes in custom electronics. Two 1.5 V C batteries were selected to power the logger due to wide availability. To meet the requirement of accurate and remote monitoring, the system was designed to collect data for at least 30 days at a time. Although various modes of wireless transmission were considered, the initial prototype logs data to SD cards, which are reliable, inexpensive, and familiar to field staff. d) Data Analysis: To translate raw weight and temperature data into metrics of cookstove performance and usage, a simple algorithm was developed to integrate reductions in mass over time. Mass changes are also corroborated with temperature to verify an actual cooking event. Fuel consumption and cookstove temperature are then used to report cookstove usage and duration of a cooking event, and be extrapolated to emissions, carbon credits, and averted Disability Adjusted Life Years (aDALYs) (Ventrella and MacCarty 2018).
As mentioned earlier, our new methodological approach turned out to be especially powerful and rewarding at the stage of data processing and interpretation. After receiving data from a field study of 100 sensors in Uganda in 2017, the project team began the procedure of processing, cleaning and analyzing the raw data to output useful and accurate metrics of fuelwood use. As a member of this project team, an electrical engineering student wrote an algorithm designed to remove quick, linear spikes (see Figure 2 below) in the weight data above a certain threshold and applied this algorithm to the data set from Uganda. Outlier data points were attributed to noise or accidental human interaction and removed from logging history using this algorithm. However, another lab member on the team offered some field evidence to explain these spikes in sensor-recorded data. She had been using the FUEL sensor to measure fuel consumption of an institutional sized cookstove in a school dormitory of over 100 girls. The dormitory cook who would be interacting with the FUEL sensor had safety concerns about leaving the sensor out in the dormitory and asked if he could hang it up only to quickly weigh the wood before cooking, and then store it away in a safe space for the remainder of the day. This kind of interaction with the FUEL sensor resulted in brief, linear spikes that represented a rapid but intentional addition and then removal of the wood. These linear spikes were not noise to be removed; they were usable and invaluable data points that could only be explained and accounted for using ethnographic data. This contextual evidence was imperative to more accurately interpret and process the sensor-recorded data. Without the contextual evidence from ethnographic fieldwork, the FUEL project team would still be using data that are not fully representative of actual human activity and are therefore incomplete and not nearly as meaningful. The challenge with the spikes was not an isolated incidence though. Survey and informal interviews identified various concerns or problems that the users reported to have with the FUEL sensor system: fear of LED on the sensor, thermocouple burnt up, the need to chop wood into smaller pieces, minor injury, and fuel holder moving during use. Participant observation helped to re-establish the habitual and deep-rooted process of firewood collection, storage, and the following meal preparation and cooking in different household size and home space layout. Women would often multitask, which created additional complexity in measuring time and determining what was being done with any spare time. The ethnographic methods used also illuminated aspects of the lifestyle, gender relations, and daily rituals that further defined the context in which the problem of more accurately measuring impact metrics was situated.
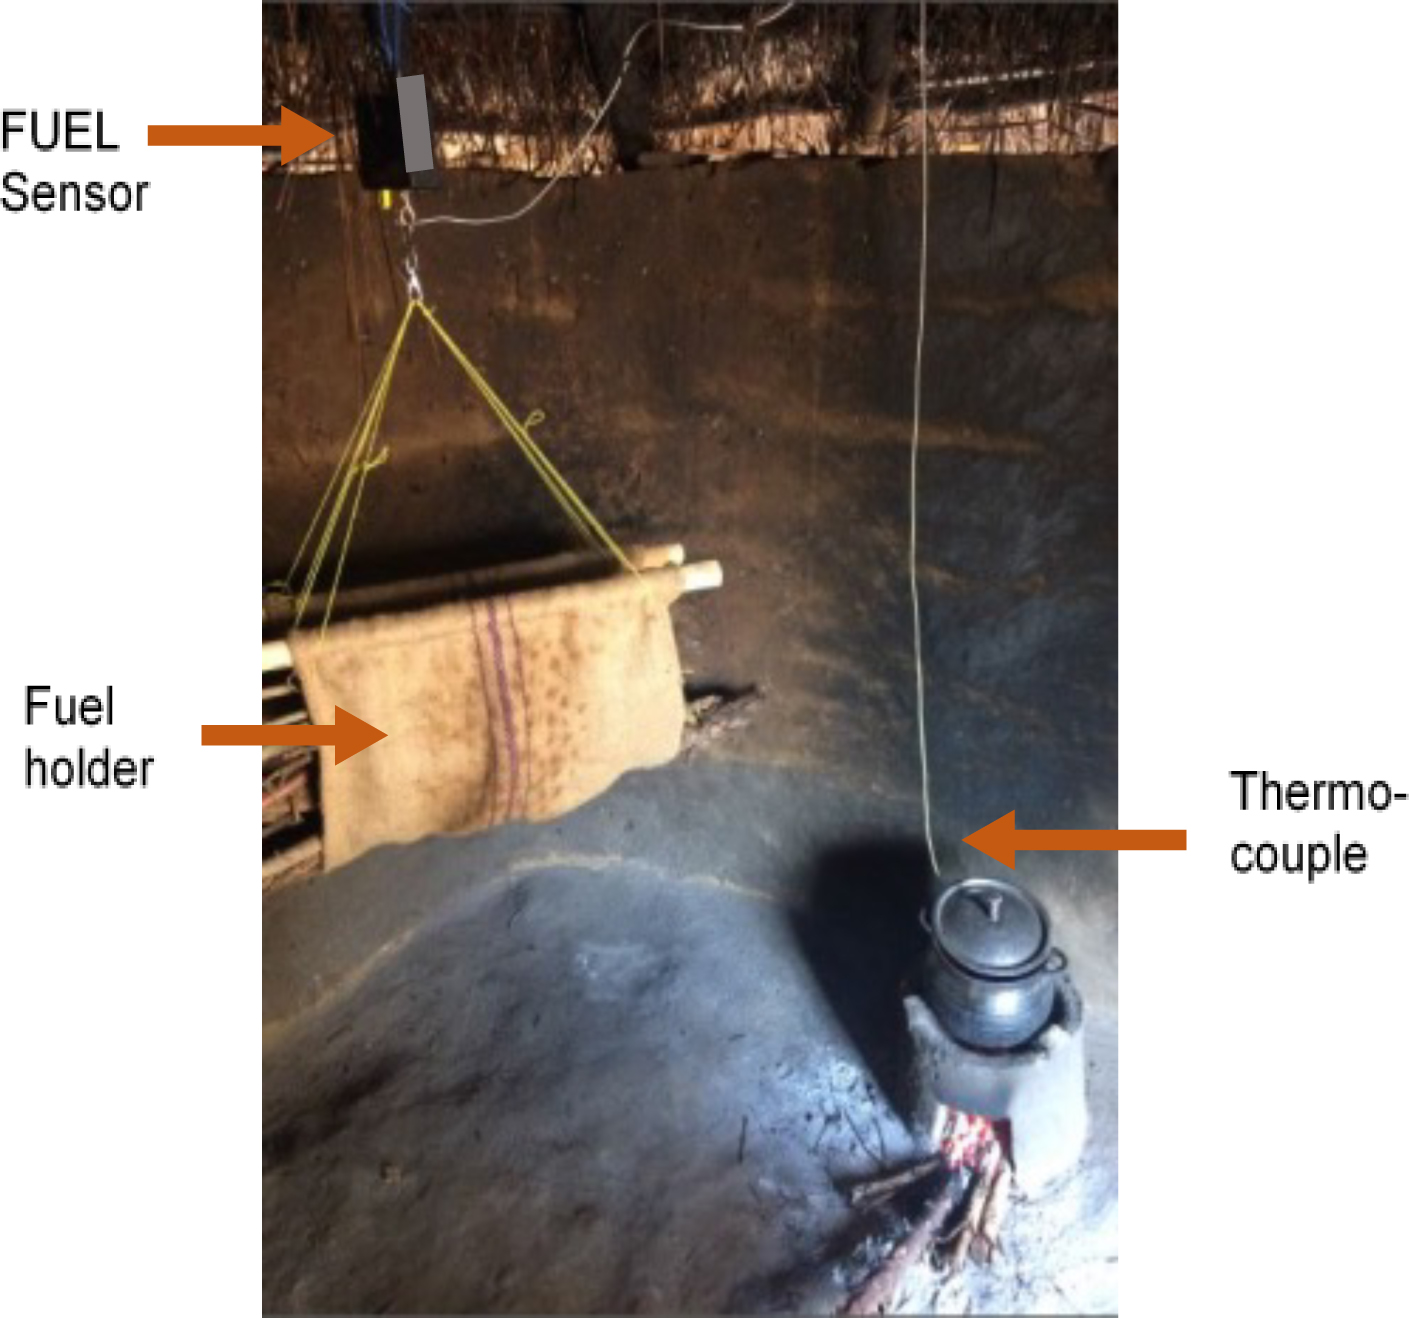
Figure 1: an installed FUEL prototype system in a rural household in Uganda
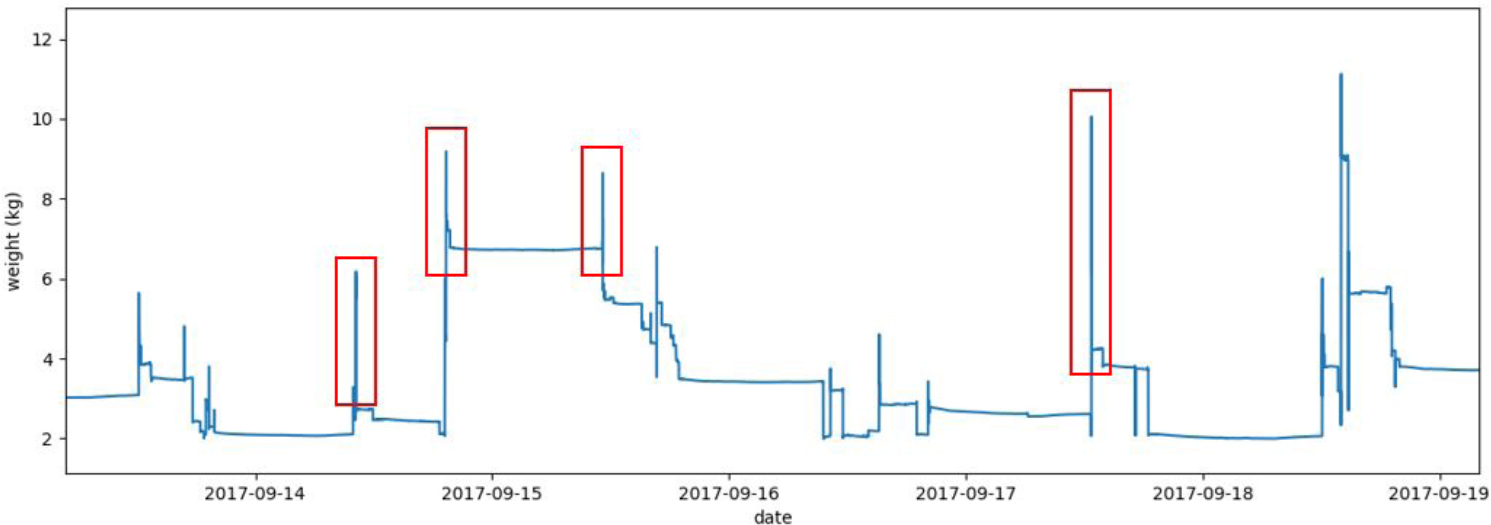
Figure 2. FUEL sensor data, with linear spikes
This case study of a still evolving and expanding project has already turned out to be a very rewarding experiment for us in multiple terms. First, the initial results from this mixed method project so far have demonstrated the essential needs to incorporate ethnographic methods and contextual data. On top of that, we want to point out that digital data recorded by sensors installed in people’s real life and data generated in traditional science labs are essentially different. Therefore, we should treat the former differently. We suggest a new methodological approach to sensor-based big data, not as data from controlled or well-defined environment, but as digital recordings of human behaviors embedded in broader social-cultural contexts. Second, this case study successfully demonstrates the power of this experimental approach in turning sensor-based data, especially the outlier data points in our case, into accurate and actionable data. It thus informs and advances the design process, for example by minimizing, if not entirely ridding, the so-called “pro-innovation bias”. Beginning with the most simplified version of a product and adding additional functionality only after the context is better understood with our new approach to data can be a more effective method than creating initial complex solutions. This finding speaks to the concept of pro-innovation bias, which theorizes that engineers and designers are biased towards creating new, disruptive innovations instead of implementing more stable changes (Rogers 1983). Third, this is not to underplay the value of big data or to suggest less use of big data. To the opposite, we applaud and embrace the increasing use of big data, sensor-based or not, especially in the fields of humanitarian technologies and global development which have been primarily relying on traditional “small” data (e.g. survey-based) to monitor and evaluate product performance and project impacts. Much beyond the level of individual products or projects, big data can be further used to establish and improve technology standards and to increase accountability and transparency of these fields. Forth, our methodological experiment also seeks to engage the question of data saturation, or simply, how big is big enough. Bigger data usually do have the potential for more objectivity, but that would definitely entail higher costs of human labor and physical resources, especially in the case sensor-based big data. To this question, we fall back to data diversity and advocate for our integrative approach to data—big or small, convenient or inconvenient, true or “falsified”—all as human behavioral traces that need to, and can, be re-contextualized for more informed processing, more accurate interpretation and eventually more cost-effective use of data.
DISCUSSION AND FUTURE RESEARCH
In this paper, we propose an innovative methodological approach to big data, an archaeological-ethnographic approach that aims to address the challenge of big data veracity and to enhance big data interpretation. It draws upon our three recent case studies of “falsified” or noise data in different big data environments: one on locational data falsified by Pokémon Go gamers using location-spoofing techniques and bots, another on worldwide fake locational check-ins on social media in support of the Standing Rock pipeline protests in North Dakota, and the other on noise data resulted from everyday life activities in sensor-based big datasets in global development projects of improved cookstove. The rich findings from our mixed-method analysis of these problematic data fundamentally challenge the current common practice of data cleaning by simply removing inconvenient data in big data management and analytics. In more fundamental terms, we point to a new data landscape today, made up of hybrid space, decentralized online social movement, and sensor installed in people’s life as illustrated above, as the context of the generation or production of big data. We suggest to rethink the epistemological nature of big data as essentially different from data generated in controlled environment of traditional science labs. Hence, we integrate an archaeological approach to big data as but another kind of human behavioral traces in the era of ubiquitous computing in human history. With that, we reason big data should not be taken for its face value, and the inconvenient data should not be simply discarded as unusable noise before analysis. Instead, we suggest to incorporate an ethnographic approach in the processing and interpretation of big data, including inconvenient data, in broader social, cultural, economic and historical contexts of human behaviors. Reusing our case studies, we demonstrate the advantages of our archaeological-ethnographic approach in discovering the values (5th V) in big data. At last, we call to rethink what ethnography and anthropology can offer to other fields, such as data science, tech industries and global development, for more informed knowledge discovery and decision-making in today’s world of big data.
Shaozeng Zhang conducts research in applied anthropology and Science and Technology Studies (STS). He received his PhD in anthropology from the University of California, Irvine in 2014. He is currently an Assistant Professor of anthropology at Oregon State University. His email address is shaozeng.zhang@oregonstate.edu
NOTES
Acknowledgments – Thanks to the reviewers and curators of EPIC 2018 for their thoughtful commentaries, which really helped shape this paper.
REFERENCES
Aipperspach, R., Cohen, E., & Canny, J.
2006 Modeling Human Behavior from Simple Sensors in the Home. In K. Fishkin, B. Schiele, P. Nixon, & A. Quigley (Eds.), Pervasive Computing (pp. 337–349). Dublin. Retrieved from https://link.springer.com/content/pdf/10.1007%2F11748625.pdf
Akoumianakis, Demosthenes, Ioannis Kafousis, Nikolas Karadimitriou, and Manolis Tsiknakis.
2012a Retaining and exploring online remains on YouTube. In Emerging Intelligent Data and Web Technologies (EIDWT), 2012 Third International Conference on, pp. 89-96. IEEE.
Akoumianakis, Demosthenes, Nikolas Karadimitriou, George Vlachakis, Giannis Milolidakis, and Nik Bessis.
2012b Internet of things as virtual settlements: Insights from excavating social media sites. In Intelligent Networking and Collaborative Systems (INCoS), 2012 4th International Conference on, pp. 132-139. IEEE.
Alles, M., & Vasarhelyi, M. A.
2014 Thick data: adding context to big data to enhance auditability. International Journal of Auditing Technology, 2(2), 95. https://doi.org/10.1504/IJAUDIT.2014.066237
Asay, M.
2014 8 Reasons Big Data Projects Fail – InformationWeek. Retrieved March 22, 2018, from https://www.informationweek.com/big-data/big-data-analytics/8-reasons-big-data-projects-fail/a/d-id/1297842
Bell, Genevieve.
2011 Big data as a person.” In Web Summit 2.0 Conference, October, pp. 17-19. 2011.
Berghel, Hal.
2017 Alt-News and Post-Truths in the” Fake News” Era. Computer 4: 110-114.
Bernard, H. R.
2006 Research methods in anthropology : qualitative and quantitative approaches. AltaMira Press.
Blok, A., & Pedersen, M. A.
2014 Complementary social science? Quali-quantitative experiments in a Big Data world. Big Data & Society, 1(2), 205395171454390. https://doi.org/10.1177/2053951714543908
Bonjour, Sophie, Heather Adair-Rohani, Jennyfer Wolf, Nigel G. Bruce, Sumi Mehta, Annette Prüss-Ustün, Maureen Lahiff, Eva A. Rehfuess, Vinod Mishra, and Kirk R. Smith.
2013 Solid fuel use for household cooking: Country and regional estimates for 1980-2010,” Environtal Health Perspectives, vol. 121, no. 7, pp. 784–790.
Brachman, Ronald J., Peter G. Selfridge, Loren G. Terveen, Boris Altman, Alex Borgida, Fern Halper, Thomas Kirk, Alan Lazar, Deborah L. McGuinness, and Lori Alperin Resnick.
1993 Integrated support for data archaeology. International Journal of Intelligent and Cooperative Information Systems 2, no. 02: 159-185.
Burleson, Grace, Nordica MacCarty, Kendra Sharp, and Bryan Tilt.
2018 An Interdisciplinary Mixed-Method Approach to the Evaluation of a Water Treatment Technology in Eastern Uganda.
Burrell, Jenna.
2012 The Ethnographer’s Complete Guide to Big Data: Small Data People in a Big Data World. Ethnography Matters. http://ethnographymatters.net/blog/2012/05/28/small-data-people-in-a-big-data-world/
Chatti, D., Archer, M., Lennon, M., & Dove, M. R.
2017 Exploring the mundane: Towards an ethnographic approach to bioenergy. Energy Research and Social Science. https://doi.org/10.1016/j.erss.2017.06.024
Clasen, T., Fabini, D., Boisson, S., Taneja, J., Song, J., Aichinger, E., … Nelson, K. L.
2012 Making Sanitation Count: Developing and Testing a Device for Assessing Latrine Use in Low-Income Settings. Environmental Science & Technology, 46(6), 3295–3303. https://doi.org/10.1021/es2036702
Claverie-Berge, Isabelle
2012 Solutions Big Data IBM. http://www05.ibm.com/fr/events/netezzaDM_2012/Solutions_Big_Data.pdf
Cohen, J.
2006 The new world of global health. Science, 311(5758), 162–167. https://doi.org/10.1126/science.311.5758.162
Cooper, Anwen, and Chris Green.
2016 Embracing the complexities of ‘Big Data’in archaeology: the case of the English Landscape and Identities project. Journal of Archaeological Method and Theory 23, no. 1: 271-304.
Crawford, Kate
2013 The Hidden Biases in Big Data. Harvard Business Review. http://blogs.hbr.org/cs/2013/04/the_hidden_biases_in_big_data.html
Creswell, J. W., & Creswell, J. D.
2018 Research design: qualitative, quantitative, and mixed methods approaches. (H. Salmon, Ed.) (5th ed.). Los Angeles: SAGE Publications.
Durix, L., Carlsson Rex, H., & Mendizabal, V.
2016 Contextual Design and Promotion of Clean Biomass Stoves. Washington, D.C.: LiveWire. Retrieved from https://openknowledge.worldbank.org/handle/10986/25129
Emamjome, Fahame.
2014 A theoretical approach to conceptualize information quality in social media. ACIS.
Fields, D. A., Quirke, L., Amely, J., & Maughan, J.
2016 Combining Big Data and Thick Data Analyses for Understanding Youth Learning Trajectories in a Summer Coding Camp. In Proceedings of the 47th ACM Technical Symposium on Computing Science Education – SIGCSE ’16 (pp. 150–155). New York, New York, USA: ACM Press. https://doi.org/10.1145/2839509.2844631
Frechtling, J., Sharp, L., & Westat, I. (Eds.)
1997 User-Friendly Handbook for Mixed Method Evaluations. Retrieved from http://utminers.utep.edu/mtcortez/downloads/mixed methods evaluation handbook from nsf.pdf
Garbarino, S., & Holland, J.
2009 Quantitative and Qualitative Methods in Impact Evaluation and Measuring Results Issues Paper. Retrieved from http://epapers.bham.ac.uk/646/1/eirs4.pdf
Geerts, Floris, Paolo Missier, and Norman Paton.
2018 Special Issue on Improving the Veracity and Value of Big Data. Journal of Data and Information Quality (JDIQ) 9.3: 13.
Geertz, C.
2003 Thick Description: Toward an Interpretive Theory of Culture. In Turning Points in Qualitative Research: Tying Knots into a Handkercheif (pp. 143–168). Retrieved from https://books.google.com/books?hl=en&lr=&id=y3AHb4dJy30C&oi=fnd&pg=PA143&dq=Thick+description:+toward+an+interpretive+theory+of+culture&ots=PVaz12mKr1&sig=E1Rh6T_BDZd9xi-pSIlHohsv9n0#v=onepage&q=Thick description%3A toward an interpretive theory
Geertz, C., & Darnton, R.
1973 The interpretation of cultures: selected essays (3rd ed.). New York: Basic Books.
Gitelman, Lisa. (Ed.)
2013 “Raw data” is an oxymoron. Cambridge, MA: MIT Press.
Gopal, Krishna.
2016 Data curation: the processing of data. Journal of Information Management 3, no. 1: 71-79.
Gunn, W.
1989 Design Anthroplogy. Journal of Chemical Information and Modeling (Vol. 53). https://doi.org/10.1017/CBO9781107415324.004
Guyer, J. I., & Lambin, E. F.
1993 Land Use in an Urban Hinterland: Ethnography and Remote Sensing in the Study of African Intensification. Source: American Anthropologist, New Series, 95(4), 839–859. Retrieved from http://www.jstor.org/stable/683020
Hall, Kathleen
2013 Data quality more important than fixating over big data, says Shell VP. Computerweekely.com. http://www.computerweekly.com/news/2240186887/Data-quality-more-important-than-fixating-over-big-datasays-Shell-VP
Hirst, Graeme
2007 Views of text-meaning in computational linguistics: Past, present, and future. In G. Dodig-Crnkovic & S. Stuart (Eds.), Computing, philosophy, and cognitive science: The Nexus and the Liminal. Newcastleupon-Tyne: Cambridge Scholars Press.
Honig, Caribou.
2012 In Defense Of Small Data. The Forbes. https://www.forbes.com/sites/ciocentral/2012/03/30/in-defense-of-small-data/#55ebf2aaef29
Islam, M. S., Granger, S. P., Wright, R., Ram, P. K., Hitchcock, D., Jones, T., … Luby, S. P.
2010 Is Structured Observation a Valid Technique to Measure Handwashing Behavior? Use of Acceleration Sensors Embedded in Soap to Assess Reactivity to Structured Observation. The American Journal of Tropical Medicine and Hygiene, 83(5), 1070–1076. https://doi.org/10.4269/ajtmh.2010.09-0763
Jeffery, S. R., Alonso, G., Franklin, M. J., Hong, W., & Widom, J.
2005 A Pipelined Framework for Online Cleaning of Sensor Data Streams. Berkeley. Retrieved from https://pdfs.semanticscholar.org/2dcb/7a97c2fe1184ed4ec2b83e984214a908d0a2.pdf
Johnson, R. B., & Onwuegbuzie, A. J.
2004 Mixed Methods Research: A Research Paradigm Whose Time Has Come. Educational Researcher, 33(7), 14–26. https://doi.org/10.3102/0013189X033007014
Jones, Q.
1997 Virtual-communities, virtual settlements, and cyber-archaeology: a theoretical outline. Journal of Computer-Mediated Communication, 3(3).
Kintigh, Keith, Jeffrey H. Altschul, Ann P. Kinzig, Timothy Kohler, W. Fredrick Limp, William K. Michener, Jeremy A. Sabloff, Edward J. Hackett, Bertram Ludäscher, and Clifford A. Lynch.
2015 Cultural Dynamics, Deep Time, and Data: Planning Cyberinfrastructure Investments for Archaeology. Advances in Archaeological Practice 3(1): 1-15. DOI: 10.7183/2326-3768.3.1.1
Latour, B.
1988 The pasteurization of France. Harvard University Press. Retrieved from https://books.google.com/books/about/The_Pasteurization_of_France.html?id=J26KoKtyTxkC
Latour, B., Jensen, P., Venturini, T., Grauwin, S., & Boullier, D.
2012 The whole is always smaller than its parts’ – a digital test of Gabriel Tardes. The British Journal of Sociology, 63(4), 590–615. https://doi.org/10.1111/j.1468-4446.2012.01428.x
Law, J.
2009 Actor Network Theory and Material Semiotics. In B. S. Turner (Ed.), The new Blackwell companion to social theory (p. 618). Wiley-Blackwell. Retrieved from https://books.google.com/books?hl=en&lr=&id=Ku51GZC6FwcC&oi=fnd&pg=PA141&ots=RzbSNp4yhv&sig=oHYIgZTcNKLViTnl-_B5e-YN8nY#v=onepage&q&f=false
Lazer, David, Ryan Kennedy, Gary King, and Alessandro Vespignani.
2014 The parable of Google Flu: traps in big data analysis. Science 343, no. 6176: 1203-1205.
Lukoianova, Tatiana, and Victoria L. Rubin.
2014 Veracity roadmap: Is big data objective, truthful and credible?. https://ir.lib.uwo.ca/cgi/viewcontent.cgi?article=1065&context=fimspub
Madsbjerg, C.
2017 Sensemaking: the power of the humanities in the age of the algorithm. New York: Hachette Book Group, Inc.
Mai, Jens-Erik.
2013 The quality and qualities of information. Journal of the American Society for Information Science and Technology, 64(4), 675-688. doi: 10.1002/asi.22783
Maxwell, C. R.
2016 Accelerated Pattern Recognition, Ethnography, and the Era of Big Data. In B. Jordan (Ed.), Advancing Ethnography in Corporate Environments (pp. 175–192). Routledge. https://doi.org/10.4324/9781315435459-16
Milolidakis, Giannis, Demosthenes Akoumianakis, and Chris Kimble.
2014a Digital traces for business intelligence: A case study of mobile telecoms service brands in Greece. Journal of Enterprise Information Management, Vol. 27 Issue: 1, pp.66-98, https://doi.org/10.1108/JEIM-09-2012-0061
Milolidakis, Giannis, Demosthenes Akoumianakis, Chris Kimble and Nikolas Karadimitriou.
2014b Excavating Business Intelligence from Social Media. In Encyclopedia of Business Analytics and Optimization, ed. John Wang, 897-908, accessed July 25, 2018. doi:10.4018/978-1-4666-5202-6.ch084
Moritz, Mark.
2016 Big data’s ‘streetlight effect’_ where and how we look affects what we see. http://theconversation.com/big-datas-streetlight-effect-where-and-how-we-look-affects-what-we-see-58122
Mosse, D.
2004. Cultivating Development: An Ethnography of Aid Policy and Practice. Retrieved March 17, 2018, from https://ebookcentral.proquest.com/lib/osu/reader.action?docID=3386658&query=
Muraskin, W.
2004 The Global Alliance for Vaccines and Immunization: Is It a New Model for Effective Public–Private Cooperation in International Public Health? American Journal of Public Health, 94(11). Retrieved from http://ajph.aphapublications.org/doi/pdf/10.2105/AJPH.94.11.1922
Naumoff, K.
2007 Quantitative Metrics of Exposure and Health for Indoor Air Pollution from Household Biomass Fuels. University of California, Berkeley. Retrieved from https://pqdtopen.proquest.com/doc/304900697.html?FMT=AI
Newman, Martin.
2011 The Database as Material Culture. Internet Archaeology 29. https://doi.org/10.11141/ia.29.8. Accessed 3 July 2018.
Nolan, Jason, and Michelle Levesque.
2005 Hacking human: data-archaeology and surveillance in social networks. ACM SIGGROUP Bulletin 25, no. 2: 33-37.
O’Reilly, K., Louis, E., Thomas, E., & Sinha, A.
2015 Combining sensor monitoring and ethnography to evaluate household latrine usage in rural India. Journal of Water, Sanitation and Hygiene for Development, 5(3), 426. https://doi.org/10.2166/washdev.2015.155
Paccagnella, L.
1997 Getting the seats of your pants dirty: Strategies for ethnographic research on virtual communities. Journal of Computer-Mediated Communication, 3(1).
Ponterotto, J. G.
2006 Brief Note on the Origins, Evolution, and Meaning of the Qualitative Research Concept Thick Description. The Qualitative Report, 11(3), 538–549. Retrieved from http://nsuworks.nova.edu/tqr
Robbins, K.
2013 Balancing the scales: Exploring the variable effects of collection bias on data collected by the Portable Antiquities Scheme. Landscapes, 14(1), 54–72.
Roden, C. A., Bond, T. C., Conway, S., Osorto Pinel, A. B., MacCarty, N., & Still, D.
2009 Laboratory and field investigations of particulate and carbon monoxide emissions from traditional and improved cookstoves. Atmospheric Environment, 43(6), 1170–1181. https://doi.org/10.1016/J.ATMOSENV.2008.05.041
Rogers, Everett M.
1983 Diffusion of innovations. Simon and Schuster.
Rolland, B.
2016 Data Sharing and Reuse: Expanding Our Concept of Collaboration – Team Science Toolkit. Retrieved March 18, 2018, from https://www.teamsciencetoolkit.cancer.gov/public/ExpertBlog.aspx?tid=4
Rosenberg, Daniel.
2013 “Data before the fact.” Chapter 15 in Lisa Gitelman (Ed.) “Raw data” is an oxymoron. Cambridge, MA: MIT Press.
Rosenthal, J., Balakrishnan, K., Bruce, N., Chambers, D., Graham, J., Jack, D., … Yadama, G.
2017 Implementation science to accelerate clean cooking for public health. Environmental Health Perspectives. https://doi.org/10.1289/EHP1018
Ruiz-Mercado, I., Canuz, E., & Smith, K. R.
2012 Temperature dataloggers as stove use monitors (SUMs): Field methods and signal analysis. Biomass and Bioenergy. https://doi.org/10.1016/j.biombioe.2012.09.003
Saha, Barna, and Divesh Srivastava.
2014 Data quality: The other face of big data.” In Data Engineering (ICDE), 2014 IEEE 30th International Conference, pp. 1294-1297.
Schroeck, Michael, Rebecca Shockley, Janet Smart, Dolores Romero-Morales, and Peter Tufano.
2012 Analytics: The real-world use of big data. IBM Global Business Services 12 (2012): 1-20.
Silver, Nate.
2012 The Signal and the Noise. New York: Penguin.
Simons, A. M., Beltramo, T., Blalock, G., & Levine, D. I.
2014 Comparing methods for signal analysis of temperature readings from stove use monitors. Biomass and Bioenergy. https://doi.org/10.1016/j.biombioe.2014.08.008
Smith, Heather
2013 Big data FAQs – a primer. biblog.arcplan.com/2012/03/big-data-faqs-a-primer/
Snodgrass, Jeffrey G.
2015 Ethnography of online cultures. pages 465-496 in Bernard, H. Russell, and Clarence C. Gravlee, eds. Handbook of methods in cultural anthropology. Rowman & Littlefield
Søe, Sille Obelitz.
2018 Algorithmic detection of misinformation and disinformation: Gricean Perspectives. Journal of Documentation, 74(2), pp.309-332.
Sovacool, B. K.
2014 What are we doing here? Analyzing fifteen years of energy scholarship and proposing a social science research agenda. Energy Research & Social Science, 1, 1–29. https://doi.org/10.1016/J.ERSS.2014.02.003
Stanistreet, D., Hyseni, L., Bashin, M., Sadumah, I., Pope, D., Sage, M., & Bruce, N.
2015 The role of mixed methods in improved cookstove research. Journal of Health Communication. https://doi.org/10.1080/10810730.2014.999896
Stern, P. C.
2014 Individual and household interactions with energy systems: Toward integrated understanding. Energy Research & Social Science, 1, 41–48. https://doi.org/10.1016/J.ERSS.2014.03.003
Thomas, E. A.
2017 Beyond broken pumps and promises: Rethinking intent and impact in environmental health. Energy Research & Social Science, 25, 33–36. https://doi.org/10.1016/J.ERSS.2016.12.006
Thomas, E. A., Barstow, C. K., Rosa, G., Majorin, F., & Clasen, T.
2013 Use of remotely reporting electronic sensors for assessing use of water filters and cookstoves in Rwanda. Environmental Science and Technology. https://doi.org/10.1021/es403412x
Thomas, E., Zumr, Z., Graf, J., Wick, C., McCellan, J., Imam, Z., … Fleming, M.
2013 Remotely Accessible Instrumented Monitoring of Global Development Programs: Technology Development and Validation. Sustainability, 5(8), 3288–3301. https://doi.org/10.3390/su5083288
Thomson, P., & Koehler, J.
2016 Performance-oriented monitoring for the water SDG – challenges, tensions and opportunities. Aquatic Procedia, 6, 87–95. https://doi.org/10.1016/j.aqpro.2016.06.010
Ventrella, Jennifer and Nordica MacCarty
2018 Development and pilot study of an integrated sensor system to measure fuel consumption and cookstove use,” in 2018 International Design Engineering Technical Conference.
Ventrella, Jennifer, Nordica MacCarty and Shaozeng Zhang
2018 A Mixed-Method Approach: Design of a Novel Sensor System to Measure Cookstove Usage and Fuel Consumption. IEEE GHTC 2018
Wang, T.
2016 Why Big Data Needs Thick Data. Retrieved March 22, 2018, from https://medium.com/ethnography-matters/why-big-data-needs-thick-data-b4b3e75e3d7
Wesson, Cameron, and John Cottier.
2014 Big Sites, Big Questions, Big Data, Big Problems: Scales of Investigation and Changing Perceptions of Archaeological Practice in the Southeastern United States. Bulletin of the History of Archaeology 24.
Wolaver, B. D., & Sharp, J. M.
2007 Thermochron iButton: Limitation of this Inexpensive and Small-Diameter Temperature Logger. Groundwater Monitoring & Remediation, 27(3), 127–128. https://doi.org/10.1111/j.1745-6592.2007.00158.x
Zhao, Bo, and Shaozeng Zhang.
2018 Rethinking Spatial Data Quality: Pokémon Go as a Case Study of Location Spoofing. The Professional Geographer: 1-13.
Zhang, Shaozeng, Yuanyuan Tian, Bo Zhao and Shenliang Chen
Upcoming Stand with #StandingRock: Location-based social media in the post-truth era. The Annals of the American Association of Geographers.
Zimbra, David, Ahmed Abbasi, and Hsinchun Chen.
2010 A cyber-archaeology approach to social movement research: Framework and case study. Journal of Computer-Mediated Communication 16, no. 1: 48-70.