
Case Study—Declining clinician engagement, increasing rates of burnout, and stagnant patient and family experience scores have led hospital leadership at Seattle Children’s Hospital to submit requests to a data scientist and an anthropologist to identify key themes of survey comments and provide recommendations to improve experience and satisfaction. This study explored ways of understanding satisfaction as well as analytic approaches to textual data, and found that various modes of evidence, while seemingly ideal to leaders, are hard pressed to meet their expectations. Examining satisfaction survey comments via text mining, content analysis, and ethnographic investigation uncovered several specific challenges to stakeholder requests for actionable insights. Despite its hype, text mining struggled to identify actionable themes, accurate sentiment, or group distinctions that are readily identified by both content analysis and end users, while more insightful ethnographic results were sometimes discounted for lack of quantitative results or perceived implementation difficulty. Unfortunately, institutional contexts and preferences for specific types of data can lead to unnecessary requests and wasted efforts. Through including the subjective lifeworld, how an individual’s lived experiences impact interactions with others, the authors were able re-humanize satisfaction. Cross-discipline collaboration can enhance the quality, validation, and advocacy of evidence from both qualitative and quantitative data. Co-developing a “Return on Method” (ROM) of satisfaction data can help improve analytic requests and expectations by end users. Ultimately, a lifeworld-informed combination of data science and ethnography can provide contextual and culturally situated insights that are both meaningful and actionable.
INTRODUCTION
Patient experience—in both quality of care and satisfaction—is one of the major improvement goals across every dimension and domain of healthcare in the United States, from neighborhood community health centers to major, internationally-known hospitals (Institute of Medicine 2001). Driven by changing regulations and increasing competition, the healthcare industry believes that more satisfied patients will lead to more revenue, suggesting that a service-oriented model to attract and retain patients will be required to remain competitive. The Affordable Care Act already provides strong financial incentives to improve satisfaction: 25 percent of adult hospital reimbursements from Medicaid are based on how well a hospital performs on the Hospital Consumer Assessment of Healthcare Providers and Systems (HCAHPS) survey. Further, because clinician burnout and engagement are linked to patient satisfaction scores (Bodenheimer & Sinsky 2014), there is a simultaneous desire to measure and improve satisfaction of employees (Mahan 2016; Baer et al. 2017; Azam et al. 2017; West et al. 2018). These shifts have impacted how leaders prioritize improvements to their processes and services, and hospitals are feeling strong pressure to emphasize satisfaction while maintaining or improving their already high standards of safety and public accountability (Balik et al. 2011).
At Seattle Children’s Hospital, a hospital, surgery, and specialty care system serving a population of 2.8 million children across Alaska, Idaho, Montana, and Washington, operational leaders at all levels are tasked with improving experiences and satisfaction. These stakeholders include busy, information-burdened physicians, nurses, and administrative leaders, across inpatient, outpatient, and business settings. When experience and satisfaction key performance indicators (KPIs) don’t move as desired, they look to survey comments or other forms of qualitative feedback to help decide how and where to implement improvement efforts. Recently, these leaders have started asking for quantitative analysis of survey comments, in hopes of providing those data with the same level of confidence they obtain from their KPIs. In spite of the methodological and epistemological difficulties inherent to such a mix (LaVela & Gallan 2014), hospital leaders are now asking for in-depth quantitative analysis of qualitative data that they previously felt was unmeasurable or too complex to tackle.
The authors are an anthropologist in patient and family experience who works on projects involving human-centered design, ethnographic assessments, and survey analysis, and a data scientist who works on projects primarily in neurology and critical care, but who is often asked to consult on advanced analytics topics across the enterprise. Recently, both analysts independently received requests from stakeholders about text mining survey comments to find key areas for improvement for A) two of Seattle Children’s day-surgery locations and B) employee satisfaction with a non-clinical, enterprise-wide support department. Upon comparing their requests, the authors realized that these instances raised fundamental questions with implications for business revenue and improvement strategy: What data analysis methods can best inform and improve patient and staff experiences? Can textual data provide meaningful insights efficiently?
In addition, these data requests put into question the overall approach to satisfaction and experience. In their management roles, leaders have little time to dissect the minutiae of experience, instead seeking evidence-based best practices and interventions from other institutions with the belief that such efforts will work across cultures, systems, and organizations. However, this approach minimizes the effects of the lifeworld on perceptions of care. Husserl (1936) introduced the lifeworld concept as he became increasingly concerned that quantitative measures “ignored qualities of the human experience” (Hemingway 2011: 3). The lifeworld is the whole of our lived experiences and is always at play when interacting with others, yet it is often taken for granted in our day-to-day interactions (Husserl 1936; Ekra et al. 2015; Barry et al. 2001). Dahlberg (2009) identifies that patient-centered or patient-led care often denotes an economic (patient as consumer) or political emphasis (patients as citizens). Instead, Dahlberg recognizes that patients want to be seen as people with both illness and well-being, agency and vulnerability, and can “feel unmet by interactions that emphasize one or the other” (p. 266). Thus, a framework of well-being that encompasses several realities and the tensions of everyday life may be critical to creating a healthcare experience where an individual feels “met” as a whole person (p. 269). By prioritizing satisfaction scores over patient’s lifeworld-led experiences, parents are seen simply as consumers, rather than individuals with diverse needs and agency. The lifeworld is also relevant to staff and providers who feel unfulfilled by a medical system that struggles to recognize them as both individuals and institutional members.
To address these text analysis requests, the authors recognized that they needed to acknowledge the underlying beliefs and assumptions about textual data analysis and provide clear examples of the methods and modes of evidence inherent to those methods. In both cases, the authors felt that leaders were not aware of the usefulness and drawbacks of each method, as well as the work effort involved relative to other approaches. The authors sought to address these two requests, while at the same time providing leadership with a more nuanced view of the power and problems of text mining, and of methods combining qualitative and quantitative approaches.
By sharing examples of delivering meaningful and digestible evidence from family and staff satisfaction, the authors discuss the implications of making textual evidence more useful in healthcare’s data-saturated context. A clear understanding of methodological approaches, including insights and actionable recommendations, as well as an approach to experience-based improvements that encompass the lifeworld will help decision-makers make meaningful operational choices, though perhaps not in the way leaders will expect. This case study begins to explore the larger questions for our organization: How does one make strong inferences from an “n” of one, or conversely, humanize an “n” of millions of data points? What are the best ways to connect stakeholders with evidence—both statistically and ethnographically—to support their daily work and improve the decisions they must make?
THE BUSINESS CHALLENGE
Hospitals rightfully prioritize safety and accountability. The intense regulation of healthcare means that hospitals must react to rapidly changing and sometimes ambiguous requirements from local, state, and federal government, accreditation agencies, and insurance companies, making long-term strategic planning difficult. Often, improvement efforts are a reaction to changing industry standards, compliance requirements, and competitive growth. While innovation, employee satisfaction, and customer experience are of increasing importance, it has been difficult for those priorities to compete with other long-standing needs within this constantly shifting management context.
Pediatric hospitals are currently exempt from satisfaction-based funding mandates from the federal government because child Medicaid is state funded. Yet value-based purchasing—which would include patient satisfaction—is now being considered for reimbursement by private payors, and this may soon expand into children’s Medicaid as well. Significantly, most pediatric hospitals receive more than 50% of their revenue from Medicaid (Lagasse 2017), with nearly as much from private payors. Changes in either payment approach would have wide-ranging effects on hospital operations regardless of funding source. Meanwhile, provider burnout and staff dissatisfaction have led to higher turnover and presumed lower KPI performance, both of which impact the bottom line (Azam et al. 2017; West et al. 2018).
When considering what to do to improve experience and satisfaction, leaders are usually tasked with improving Likert-score based KPIs. When those indicators don’t rise, they seek meaning and insight from free text comments and complaints that accompany survey results to try to improve patient satisfaction scores. Historically, leaders have two approaches to assessing evidence from survey comments: read it themselves or request a content analysis. When deeper insights are needed, leaders have occasionally requested ethnographic studies. Modern analytics can now apply complex algorithms to textual data, so leaders now have a fourth option, text mining, which is believed to yield high quality evidence at a low labor cost. These four methods were applied to address two business problems: improving HCAHPS-based KPIs for two day-surgery sites and assessing employee satisfaction with one non-clinical, company-wide support department using the two-question (one Likert, one free text) Net Promotor Score (NPS) approach (Reichheld 2003).
For the past two years, the HCAHPS survey’s patient satisfaction KPI (proportion scoring 9s or 10s on a 0-10 “overall satisfaction” Likert scale) has been in the mid 80s for the Olympic location and the low/mid 90s for the Cascade location, both of which compare similarly with many pediatric hospitals in the US. The employee NPS survey was to acquire a baseline for future comparisons; the initial NPS rating was below zero, a customer-service score below the industry average. Because hospital revenue is indirectly linked to patient satisfaction scores (and may soon be directly linked), and provider and employee actions and incentives can be directly linked to patient satisfaction, there is strong interest in improving these scores.
Even when given quantitative analysis of satisfaction KPIs, our stakeholders frequently ask, “What does this really mean?” While the Likert-type scores identify areas for potential improvement (e.g., “provider explained clearly”), there is no clear indication of what needs to be improved (e.g., explanations of treatment, medication, expectations) or why an improvement is needed. An implicit presupposition behind this business challenge is that by quantifying the textual responses as well as KPIs, the hospital may be able to understand that hidden meaning more clearly and use that information to subsequently improve satisfaction scores.
Quantified or not, different analytic methods can lead to different results, and consequently yield recommendations that can lead to very different business interpretations. There are two intertwined issues at play: mathematical properties of KPIs necessarily create incentive structures that can implicitly predefine certain decision strategies, and textual data analysis may not create enough explanatory evidence to help decision makers determine what interventions and improvements to support. Further, the reality of satisfaction being scored by a single KPI is often met with skepticism, given that, for example, a patient’s experience of a full week in the hospital with changing units and rotating care teams is ultimately distilled into a single satisfaction score.
The business challenge is not to simply tell the satisfaction and experience stories elicited from both qualitative and quantitative data, but also help the organization understand how different methods might lead them to different outcomes, with the goal of becoming more informed requestors and consumers of analytic techniques for text data. Because of the implicit bias towards quantitative results (regardless of ultimate usefulness), the authors believed that an exploration of Return on Method (ROM) would be an essential first step towards understanding eventual Return on Investment (ROI). The authors thus used these two business requests to create an initial ROM for the analysis of text-based data, results, and evidence.
As lessons learned about deriving evidence from text data were largely the same across the results for both business requests, this case study presents only a few selected examples from each, focusing primarily on the day-surgery comments, as that is closer to our mission.
RESEARCH DESIGN AND METHODS
Research Design
To address the issues of identifying actionable insights and increasing satisfaction KPIs, the authors decided to test approaches to data. By first testing data approaches, the authors developed their organization’s understanding of such methods, and what each can offer to interpretation, actionable insights, and benefits—as well as limitations—of such approaches. The authors compared quantitative and qualitative methods that a) stakeholders had requested, and b) that the authors felt might provide better answers for those requests. Thus, the authors compared three different ways to analyze survey comments: This entailed a detailed comparative analysis of two different satisfaction surveys:
- Hospital Consumer Assessment of Healthcare Providers and Systems (HCAHPS) patient and family experience survey results from day-surgery encounters at the Cascade and Olympic locations (anonymized), collected between October 2015 and March 2018 (2.5 fiscal years); and
- Net Promoter Score (NPS) survey of employee satisfaction with a non-clinical support department collected in January 2018.
The HCAHPS survey included 1,004 unique free-text comments from nearly 7,000 surveys. The survey can be completed in either English or Spanish. Caregivers are eligible for survey requests up to four times per year. The survey was completed by approximately 28% of visits during this time period, and 14% of survey respondents left a free-text comment. Both surveys contain the same open-ended question, “What else would you like to say about your experience?” This is the comment field stakeholders believed would hold the key to their improvement ideas.
The internal employee NPS survey included 495 free text comments from 658 survey responses, a survey response rate of just over 10%. The free-text question was, “How likely is it that you would recommend [department name] to a friend or colleague?” Again, the working idea was that these free-text comments could help identify and define service improvement areas, ideas, and solutions.
In addition to content analysis and text mining, the authors wanted to test two additional approaches to see what they might contribute to understanding and actionable insights for satisfaction: end user reading of survey comments and ethnography. The authors sought to understand if end user reading of survey comments (reading by senior and/or local leaders) was accurate compared with other, more formal, analytic methods.
While ethnography is a very different approach to data collection and analysis, the authors felt that comparing ethnographic results to survey comment analyses could illustrate how different approaches to data can yield different results, which in turn can have a real business impact. As Wang (2013) describes, “thick data”, through its rigorous sampling, analytic, and storytelling approach, provides inspirational and emotionally-based insights that can impact many aspects of business, including experience and satisfaction. Thus, a comparison of these four methodological approaches might provide insights into how evidence is constructed, including exposing the inherent issues to interpretation, actionable insights, and benefits of each approach.
Confounding our analyses are several limitations, particularly with respect to the HCAHPS survey. The vendor—and thus survey format—changed at the end of fiscal year 2017 from paper to phone surveys. Further, the earlier version of the survey contained 70+ questions, whereas the new version contains only eight. Both surveys contain the same open-ended question, however, though survey fatigue in the paper version is certainly a concern. Further, like any survey, we expect that our results suffer from survey bias, where particular (unknowable) combinations of family socio-economic status, patient outcomes, and specific within-care patient and family clinical and administrative experiences all contribute to the likelihood of whether a survey will be completed and submitted. The NPS survey was confounded by the use of the free-text question’s wording, which prompted specific comments from several respondents along the lines of “this doesn’t make any sense—we have no alternative to [department name]’s services.” Limitations notwithstanding, leaders expect answers, so the authors explored the data as if it were representative of the populations the hospital serves.
Ethical Considerations – This study was approved by the Institutional Review Board of Seattle Children’s Hospital (IRB #1138).
Methods
Content/Thematic Analysis – An inductive analysis was performed where a series of codes and definitions were created from the text to help characterize the meaning from the parents’ or employees’ perspectives. Comments were classified as positive, negative, mixed, or neutral sentiment. The codes were validated by a second coder. Once the codes were validated, they were placed into parent themes to characterize types of improvement and, for the surgery comments, at what point in the process of care. A code count (frequency) table was generated to understand if there were consistent trends over time, by location, and across locations.
End User Reading – For the employee satisfaction survey, the data scientist suggested that leaders read the comments directly and do some self-directed, casual analysis to indicate whether a comment reflected more positive or negative sentiment about the department and assign a theme of their choice to that same comment (such as “customer service” or “managerial support”). In keeping with how this might play out in practice, no formal instructions were given on how to best accomplish this task.
Text Mining – For both comment sets, exploratory text mining techniques were used to assess whether these approaches could provide useful insights, particularly because they are fast and easy to do. These included word and n-gram frequency assessment, lexicon-based sentiment analysis, word correlation analysis, and structural topic modeling using latent Dirichlet allocation. Results from employee satisfaction comments (NPS question 2) were further linked to the Likert scale results (NPS question 1) to explore how each quantitative response compared with the associated qualitative comment. All statistical analyses were performed using R 3.4.3 (R Core Team 2017).
Ethnography – The anthropologist observed and interviewed more than 300 patients and families, providing ethnographic insights to 35 clinical areas across 9 sites of care. The context of this work has been in small, clinical settings that are focused on improving some element of experience for their specific patient populations. For day-surgery, the anthropologist used empathy mapping, workshops with staff, and a focus group of 4 family advisors along with internal stakeholders, to look at location-specific issues.
Data Analysis and Methods Evaluation
Analysis of text mining was performed by the data scientist, while analysis of content analysis and ethnography were performed by the anthropologist. Both practitioners evaluated their prospective stakeholders’ ability to conduct an end user analysis by reading the comments. The authors reviewed the results together and evaluated each method by the following factors: accuracy of insights, reliability of consistent results, validity of approach to data, and if the methods met our stakeholder’s expectations of being fast, quantifiable, scalable, meaningful, and actionable.
THE VOICE OF THE PATIENT/CUSTOMER: COMPARING VOICES ACROSS METHODS
Content Analysis
Content Analysis: Topics/Themes – Qualitative content analysis of the day-surgery data identified 42 distinct codes related to possible areas for improvement in a total of 329 comments that included either negative sentiment. In addition, there were 31 codes that identified strengths out of 668 positive comments. Positive comments overwhelmingly included general statements like “thank you, great experience”, often identifying specific nurses and doctors as kind, helpful, and professional.
A benefit of content analysis is the ability to break down a theme, like communication needs, into specific content or moments throughout the experience (Table 1). However, when looking at a single unit or location like a day-surgery center, the themes become difficult to trend over time. For example, communication issues, while important to families, span many different stages, roles, and functional challenges. Stakeholders are still left wondering what to do to improve communication and when attempting to create specific recommendations, trends are quickly spread thin, leaving many options on what to improve with little prioritization. (Table 2).
Table 1. Example content analysis themes from day-surgery comments, including the broader category, more specific content, sentiment, and theme definitions.
| Parent Theme | Child Theme | Sentiment | Definition |
|---|---|---|---|
| Communication | Front staff | negative | Did not show respect or courtesy, not friendly, not helpful |
| Communication | Changes to team | negative | Different surgeon than expected, switching providers or nurses too much, residents, changes not explained well |
| Communication | Communicating expectations | negative | When procedure lasts much longer than expected, lack of regular updates |
| Communication | Parent anxiety & stress | negative | Did not feel supported or prepared |
| Communication | Concerns not heard | negative | Staff or providers did not listen, not sensitive to needs, did not address pain |
| Communication | Teamwork/communication | positive | All worked together to make comfortable and explain, consistent information |
| Communication | Communication with doctor | positive | Easy, quick, timely communication with doctor (texts within minutes, photo updates, etc.) |
| Communication | Interpreters | negative | Quality of interpretation |
| Communication | Post-op doctor communication | negative | Took longer than expected |
| Communication | Post-op get well card | positive | Appreciated the thought, felt cared for by team |
Table 2. Example content analysis themes and sentiment code counts for the Cascade day-surgery center, by fiscal year.
| Child Theme | Sentiment | FY 2016 | FY 2017 | FY 2018* |
|---|---|---|---|---|
| Front staff | negative | 2 | 1 | 2 |
| Changes to team | negative | 2 | 7 | 0 |
| Communicating expectations | negative | 2 | 1 | 0 |
| Parent anxiety & stress | negative | 0 | 1 | 1 |
| Concerns not heard | negative | 0 | 2 | 0 |
| Teamwork/communication | positive | 19 | 7 | 7 |
| Communication with doctor | positive | 5 | 4 | 1 |
| Interpreters | negative | 0 | 0 | 1 |
| Post-op doctor communication | negative | 0 | 2 | 0 |
| Post-op get well card | positive | 11 | 13 | 5 |
*FY 2018 data encompassed 6 months of responses.
While there were many codes that represented improvement opportunities, very few were consistent across fiscal years. Only three codes trended highly: wait times/delays on the day of surgery, being with their child in the recovery room, and patient comfort. Delays on the day of surgery were of acute concern to parents who felt that their child was NPO (nothing by mouth) longer than necessary. In addition, the length of time parents waited was often much longer than what they were told to expect—sometimes twice as long—causing an inability to plan for things like additional meals, entertainment, babysitting for other children, or time off work. Thus, communication and setting expectations before the day of surgery might help but how these fit into the current process is unclear.
The recovery room offered its own arrangement of topics, primarily that parents were upset or concerned that they weren’t with their child when they woke up from surgery. Parents were distressed about their child waking up in an unfamiliar place without anyone they recognize. In addition, some patients have adverse reactions to waking up from anesthesia, and parents wanted to be there to help manage it. While the Cascade surgery center allows parents to come to the recovery room when they are waking up, the Olympic location only does so on a case-by-case basis.
In both the positive and negative comments, “patient comfort” became a key insight, where parents reflected on how their child felt throughout the process. Given that only three themes trended consistently in the negative feedback, it can also be helpful to compare how parents describe when something was done well and when it could be improved. Consider the following comments:
They did an excellent job. The nurses especially were fantastic. I think my son actually thought it was a fun experience. They were excellent with distractions and assessing the needs of my child (and his parents). I was worried, but they made it so much easier to go through the first anesthetic procedure of my son’s life. They also sent a card after. He loved the Paw Patrol stickers on it.
My son & I had specific wants for my child going under procedure. I ask that no laughing gas be used for IV insertion, the IV be placed in his AC instead of hand and asked if mom could be there as he went under. I was able to go back, however they put the IV in his hand, gave him laughing gas which made him dizzy and then told me it was time to go before he was out…
In the positive feedback response, the parent identifies elements of experience that were important to them and their child, such as distraction, easing concerns by addressing needs, and sending a get-well card afterwards. However, the specific behaviors that made the team “excellent”, the nurses “fantastic”, and the experience “fun” during surgery are largely unknown, besides sending a get-well card afterwards.
When patient comfort was a negative experience, parents similarly talked about Children’s staff not addressing specific needs or easing concerns they had for their child. These comments illustrate that communication effectiveness and meeting both the parents’ and the patients’ lifeworld-led concerns are important. Yet, content analysis struggles to recommend specific interventions to access the lifeworld and improve satisfaction scores.
Content Analysis: Sentiment – As expected based on the KPI scores, content analysis found a majority of HCAHPS comments displaying positive sentiments towards their experiences. Over the 2.5 fiscal years of the data, 75% of Cascade’s comments were positive, while Olympic’s comments were 56% positive, both of which remain fairly constant over time. This suggests that Cascade does provide a better experience than Olympic, something already inferred by managers from the KPI scores.
Content Analysis: Comparing Locations – Content analysis offered some distinct insights into what may contribute to Cascade’s higher satisfaction scores. There were consistently fewer comments for Cascade that complained about wait times and day of communication (Table 3). In addition, parents provided more positive details about what the staff did to ensure comfort, set expectations, and allow them to be with their child in the recovery room. Finally, many parents from Cascade commented about the card sent to their child at home post-surgery. These subtle switches in language suggest that some of these improvements could influence the KPI, however further context about the differences between the two locations (such as populations served, facilities, staff engagement, service delivery, and flow) would also need to be considered to make such claims. In short, the comparative content analysis provided some general insights into what could be improved and why, but by itself does not provide enough actionable insights to improve the KPI.
Table 3. Code counts and trends for wait time and get-well card themes for each day-surgery location. Olympic has consistently higher complaints about delays and wait times on the day of surgery.
| Code | Location | FY 2016 | FY 2017 | FY 2018* |
|---|---|---|---|---|
| Wait time | Cascade | 6 | 3 | 7 |
| Olympic | 9 | 28 | 15 | |
| Get-well cards | Cascade | 11 | 11 | 5 |
| Olympic | 0 | 0 | 0 |
*FY 2018 data encompassed 6 months of responses.
End user results
The authors wondered if leaders might be able to read the comments themselves to inform decisions, given that they have contextual understanding and are aware of information from numerous data sources. In a post-analysis meeting with Olympic location’s day-surgery leadership, it was apparent that they had indeed read their survey comments in detail. Without hesitation, and without having yet seen the analysts’ results, a local leader listed off the top themes identified in the content analysis as areas they needed to prioritize and discussed possible interventions. In the case of the internal department satisfaction survey, the leader was also able to accurately identify sentiment and content areas to improve. Yet, when speaking with many of these leaders, they often feel that they can’t do anything about the issues identified by patients, families or staff in survey comments. They note that the issues are too large and above their scope or that they have too many other competing demands. More generally, there is often a suspicion of analyses done by leaders and not analysts, because of the common assumption that such work will result in unseen bias and casual rather than scientific analysis, leading to purposeful spin. Hence, their data requests: an attempt to bring evidence to light by which they can obtain strong, high-level support for the complex changes that may be needed.
Text Mining
The Cascade location had 538 comments, and the Olympic location had 466 comments. Within these 1,004 comments, there were 1,157 sentences, containing just over 41,600 total words, 3,035 of which were unique. With stopwords removed (“a”, “an”, “the”, “of”, numbers, and so on), there were 11,335 words, 2,493 of which were unique. These comments also contain 20,472 unique bigrams (2-word pairs) and 30,969 unique trigrams (3-word pairs) when stopwords are retained.
Text Mining: Topics/Themes – Word clouds—which quantify word counts by sizing the most common words according to total usage—are often used to summarize a collection of text, with the idea that a busy decision-maker could scan the image to get a sense of the topics/themes and tone of those comments. Data scientists are often disparaging of word clouds, partially because the frequency-based sizing is relative (e.g., compare panels A & B in Figure 1), but largely because they only reveal patterns that are already obvious. That said, people like them. Word clouds can help provide a glimpse of overall trends or patterns, even if this glimpse is, practically-speaking, useless for decision making.
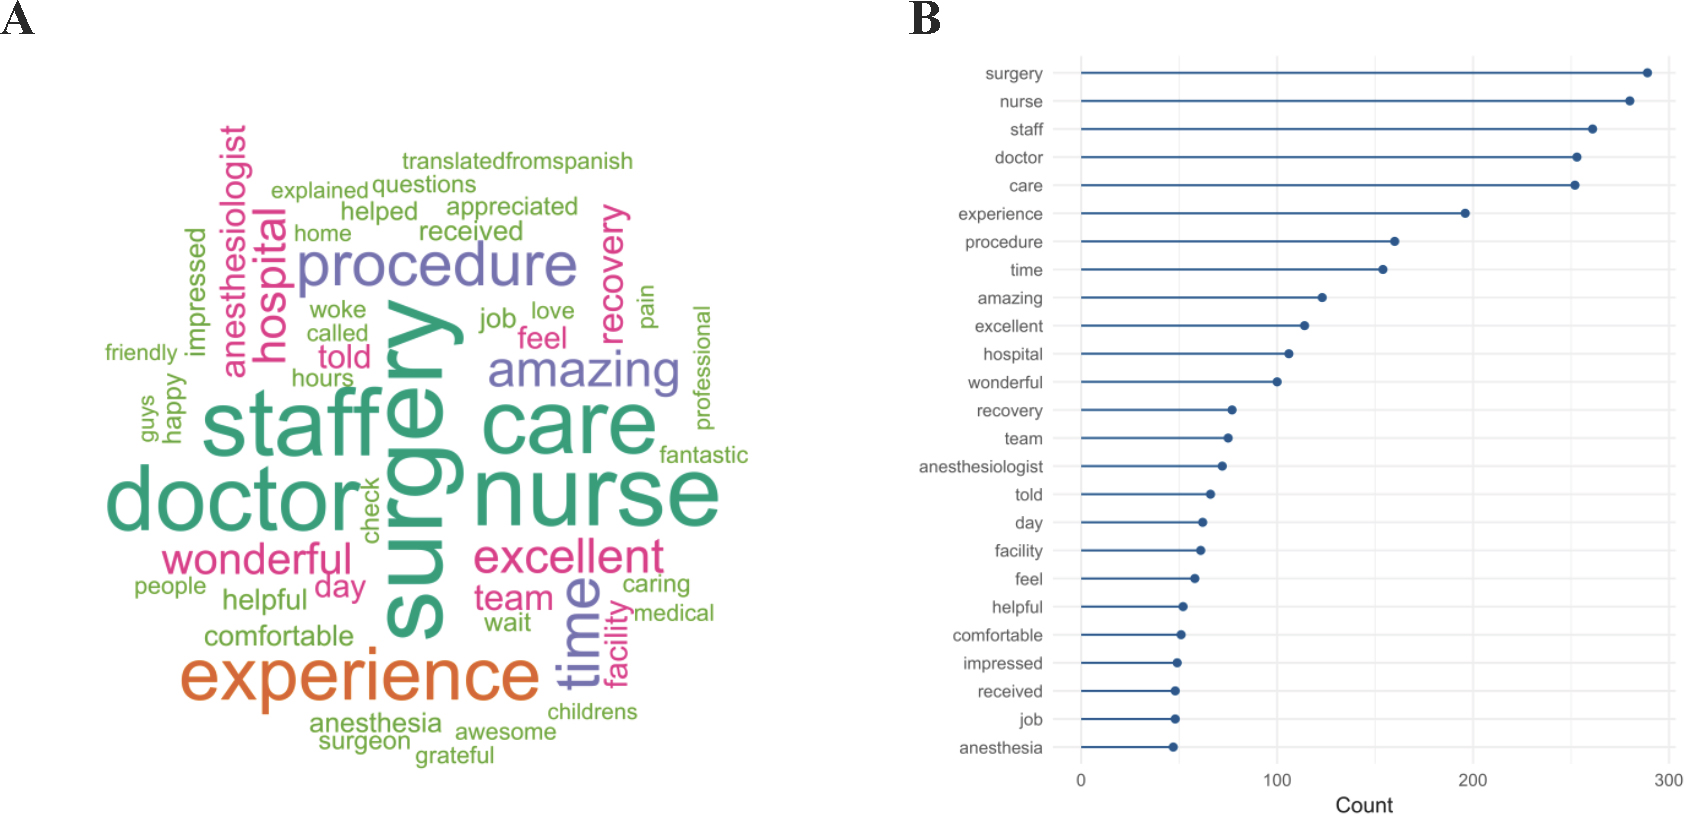
Figure 1. Pretty but vague (A) as contrasted with ugly but accurate (B) word frequencies in Cascade and Olympic locations’ day-surgery survey comments between October 2015 and March 2018.
Mining the comments for themes using structural topic modeling applies considerably more sophisticated methods to achieve similarly useless results. Unsupervised topic modeling explores text data to try to identify latent structures. Giving the algorithm a topic count of k = 14 (k is the estimated optimal number of topics based on word probability distributions) reveals many of the words seen in the word cloud as specific indicators of each latent topic (Figure 2; Table 4). While this can sometimes indicate particular themes, other times it can also create distinctions where none actually exist. For example, while topics 3 and 6 are fairly different (see Table 4 for some example comments), topics 6 and 14 cover basically the same sorts of negative comments associated with wait times. Topic 9 could be associated with recovery room issues, and 10 could be associated with scheduling, though upon inspection of comments in those topics, neither holds very strongly. The remainder of the topic groups could be reasonably lumped into a single broad topic expressing positive emotions and experiences.
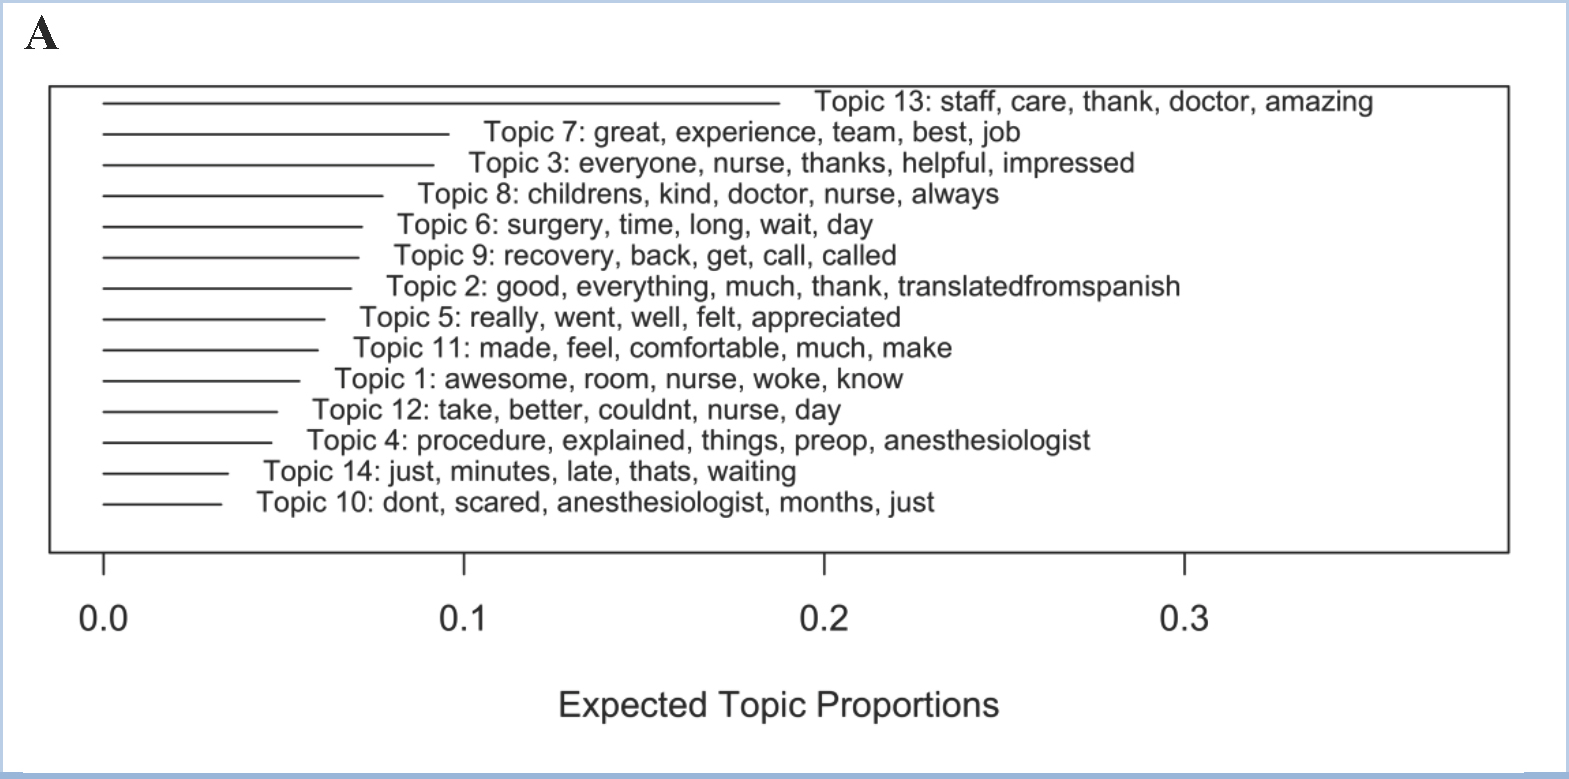
Figure 2. Structural topic model results of the day-surgery comments, given an input of k=14 topics, ordered by expected frequency of those topics across all comments. Words listed with each topic are the top 5 representative words of that topic.
Text Mining: Sentiment Analysis – Another common use of text mining is sentiment analysis using pre-made lexicons to attempt to classify a given comment as positive, negative, or neutral. Each comment is broken into individual words, which are in turn assigned a sentiment or sentiment score depending on the lexicon, the sum of which is meant to provide an overall sentiment score for that comment as a whole.
Using three different major sentiment lexicons, overall sentiment scores showed similar general patterns between lexicons—higher at Cascade—as well as some subtle differences between locations when viewed over time (Figure 3).
Using each comment’s net sentiment score from FY18 (n = 170) comments only to predict whether the comment will be a “top-box” score—which means to get at the question of whether negative sentiments are related to a respondent’s likelihood of rating the hospital highly—shows a clear but weak relationship (Figure 4 A&B; odds ratio = 1.17 [95% CI: 1.09, 1.28]), suggesting that while positive net sentiment is related to high ratings, the relationship is more ambiguous with negative sentiment. The content analysis-based sentiment category (using only “negative” or “positive” classified comments) was a better indicator than text mining for whether the respondent would rate the hospital as a 9 or a 10 (Figure 4 C&D; positive sentiment odds ratio = 7.1 [95% CI: 4.0, 13.7]), but it also did well quantitatively linking negative comments to the “not top-box” score (0s-8s) category (negative sentiment odds ratio = 0.21 [95% CI: 0.04, 0.32]).
Table 4. Examples of representative day-surgery comments for appreciative (3 and 7) and wait time-based (6 and 14) topics.
| Topic Number | Topic Keywords | Location | Example Representative Comment |
|---|---|---|---|
| 3 | everyone, nurse, thanks, helpful, impressed, caring, friendly | Cascade | Nurse ____ was so nice to our child and to us. She is a great nurse! Nurse ____ was great too. Our son was so welcomed and having fun, he forgot he was at a hospital. I wish all dr’s and nurses (even for adults) were as great as you are. Thanks!!! |
| Olympic | Everyone there was extremely kind and helpful, I had all my questions answered, they cared for my child extremely well, I couldn’t ask for a better children’s hospital. | ||
| 6 | surgery, time, long, wait, day, hours, took | Cascade | My not even two year old had to go quite a long time before surgery. I know that this is a requirement when you’re having surgery but I guess he was booked on a day that our surgeon was only doing afternoon surgeries, so he was not able to eat food from four am until … close to 12:30 and this … is a really long time without food. |
| Olympic | It would be nice not to have to wait so long between check in and the procedure. It was a bit of challenge to occupy a thirteen month old who had an empty stomach. It is a bit rough on parents who are nervous about the procedure. But also understand that it probably can’t be helped. | ||
| 7 | great, experience, team, best, job, work, recommend | Cascade | I could go on forever. I’ve never witnessed such a competent, cohesive, perfectly ran organization! Nurse ____ – Amazing! Dr. ____ – Brilliant! Thank you Seattle Childrens! |
| Olympic | The amount of care and compassion from the preop/post-op nurse, otolaryngologist and anesthesiologist were beyond my expectations. I am so glad I decided to choose Seattle Children’s and would definitely continue to recommend them to others. | ||
| 14 | just, minutes, late, thats, waiting, nurse, doctor | Cascade | They were running almost two hours late, we were not told in fact at the time of her procedure we were told we would be back in five minutes. It was frustrating to say the least. |
| Olympic | We were called an hour before check in and told the surgery was going to be delayed. Our infant had already been ‘fasting,’ and to have to delay this by another hour (last minute!) made for a very hungry baby and stressful situation for parents. |
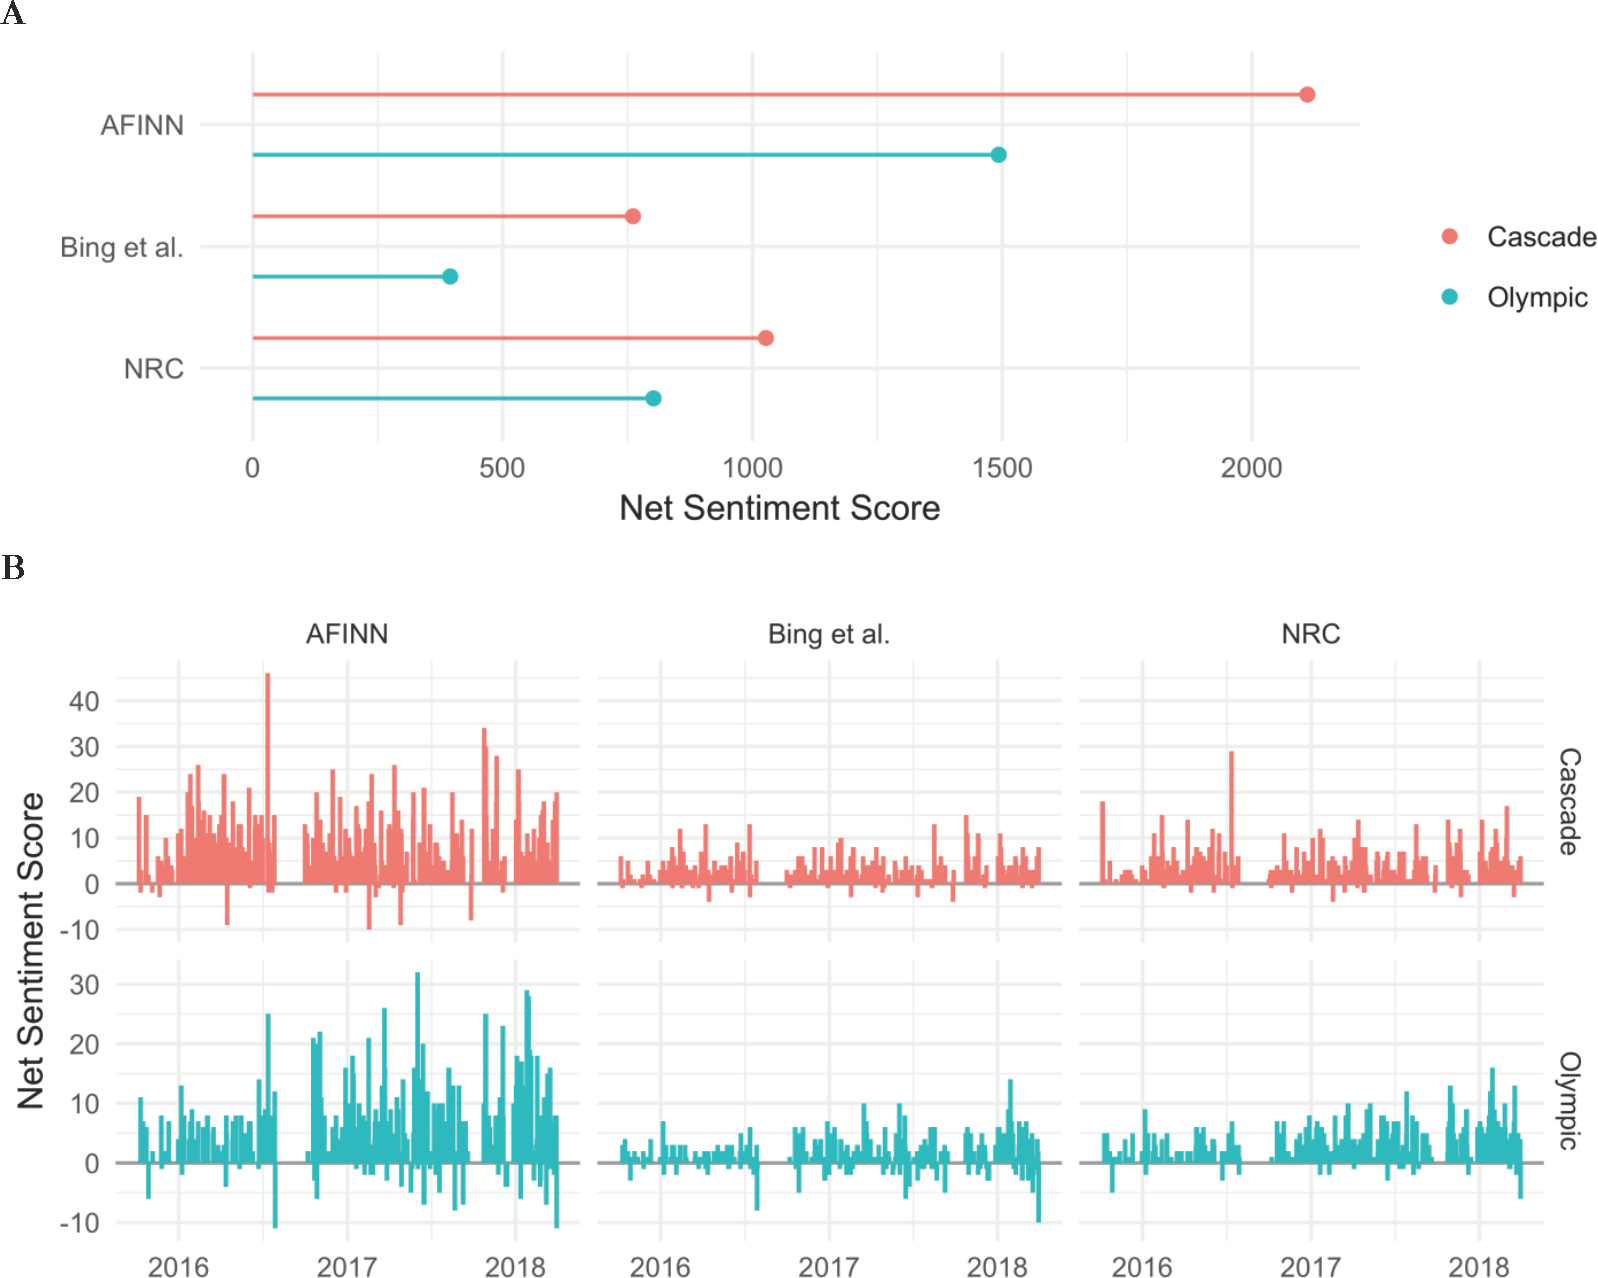
Figure 3. Day-surgery comments’ sentiment scores by location and lexicon. A) Overall sentiment score for the entire time period of the comments, Oct 2015-March 2018. B) Trends in sentiment score over time.
For the NPS-based employee survey, net comment sentiment only vaguely trended with scoring group, where the median score of detractors was lower than that of the promoters (Figure 5). However, nearly all comment sentiment scores suggested net positive ratings, even for the detractor group, for which 75% of the distribution was scored as neutral to positive sentiment.
Text Mining: Comparing Locations – Word clouds are a more common way to visualize ungrouped word frequencies, but differences between word frequency by a grouping variable—in this case, day-surgery location—can also be visualized in a single plot. Figure 6 shows the relative frequency of each word, relative to a baseline of identical frequency (the 1:1 line) between groups. Words that appear above the diagonal are more frequently seen in comments from the Cascade location, while those below the diagonal more frequently occur in the Olympic location’s comments.
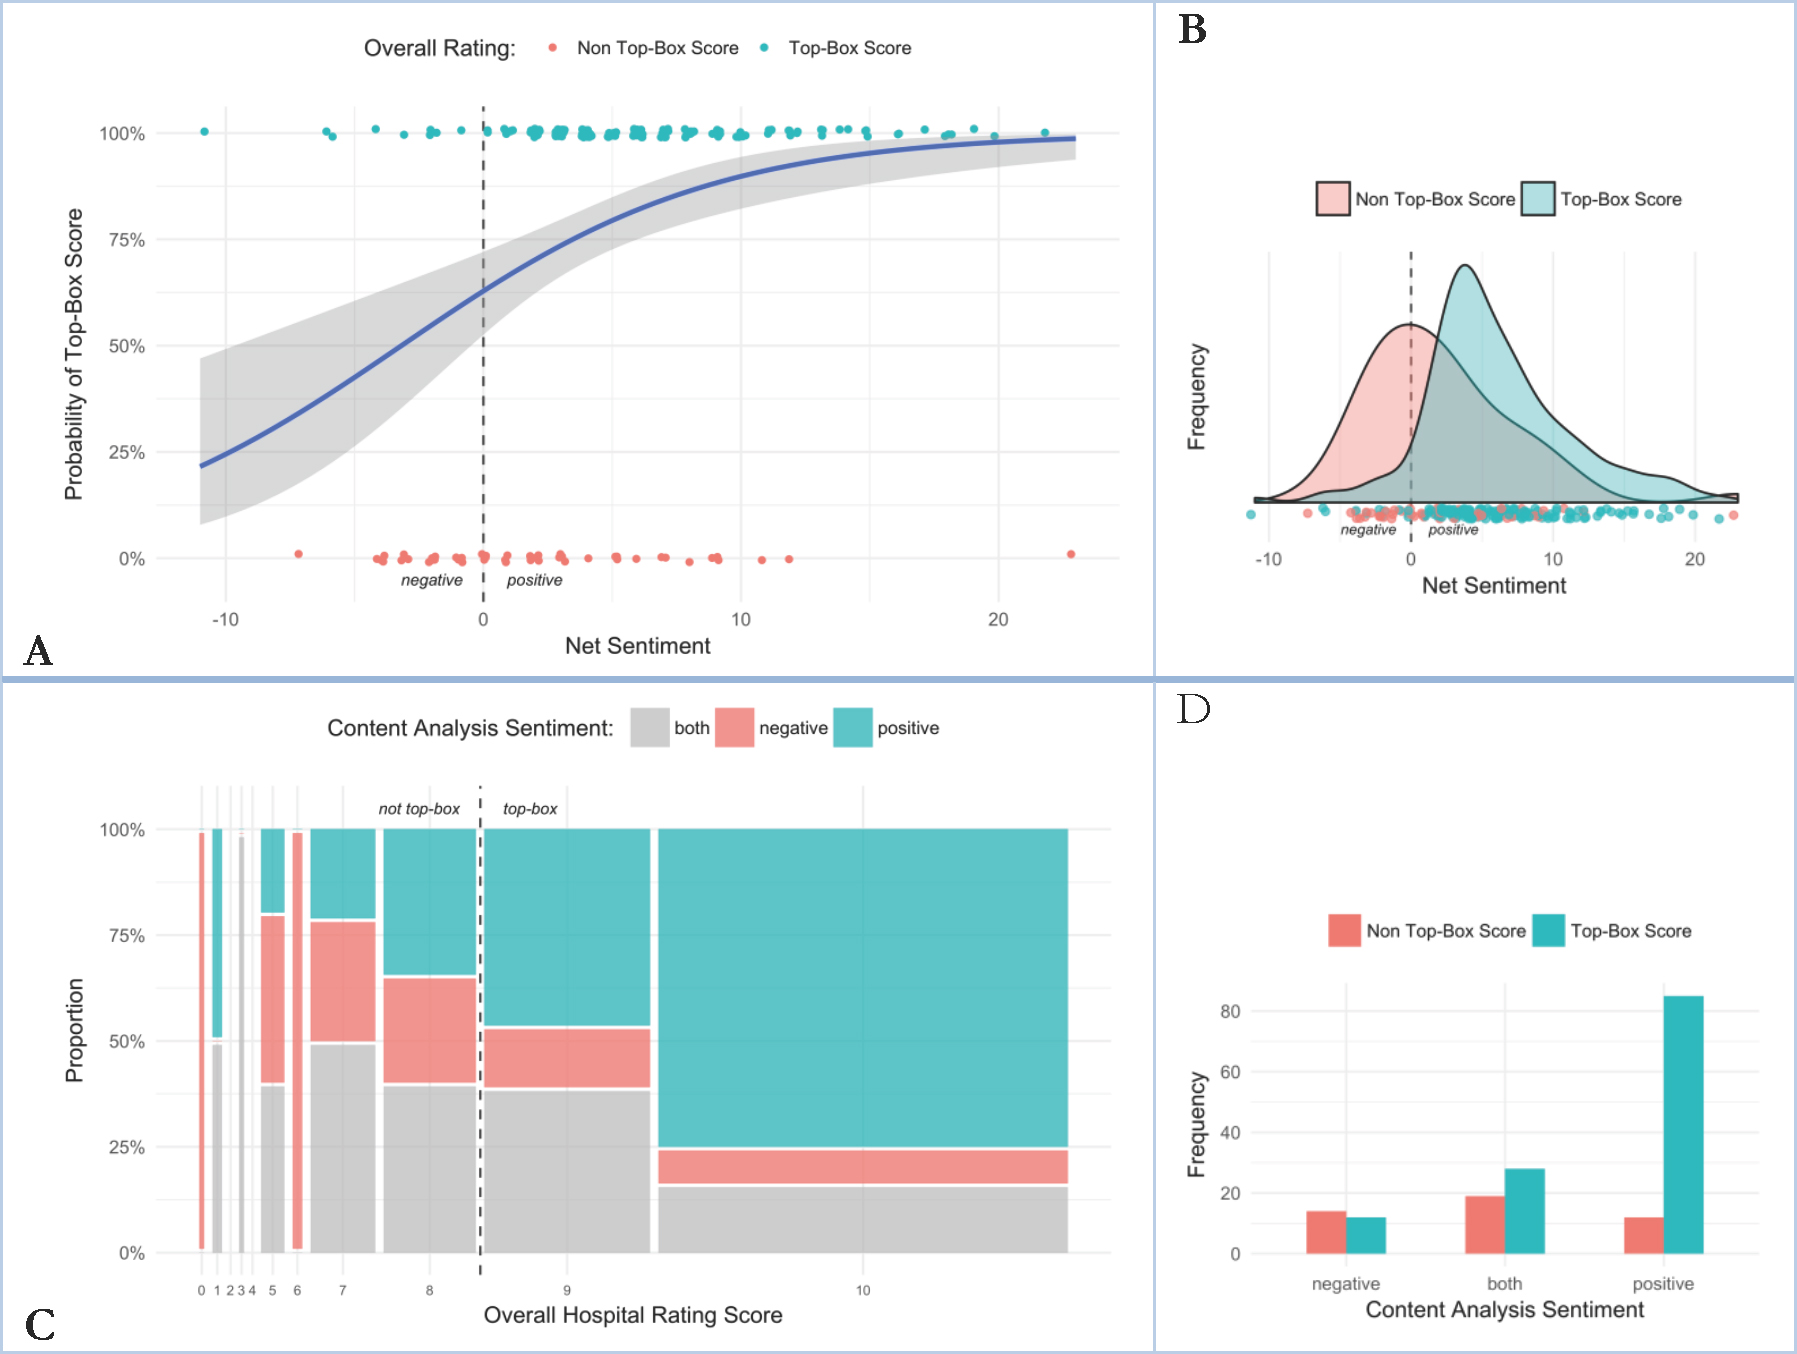
Figure 4. A) Logistic regression of AFINN-based net sentiment score to the probability of a respondent giving the hospital an overall satisfaction rating score of 9 or 10 (“top-box” score) for day-surgery comments received in fiscal year 2018. B) Distribution of net sentiment score by overall rating group. C) Mosaic plot of overall satisfaction score to content analysis-based sentiment category for day-surgery comments received in fiscal year 2018. D) Distribution of content analysis-based sentiment score relative to top-box category. These results were already obvious to end users in a qualitative sense: satisfied patients and families (who respond to the survey) respond positively with high KPI scores.
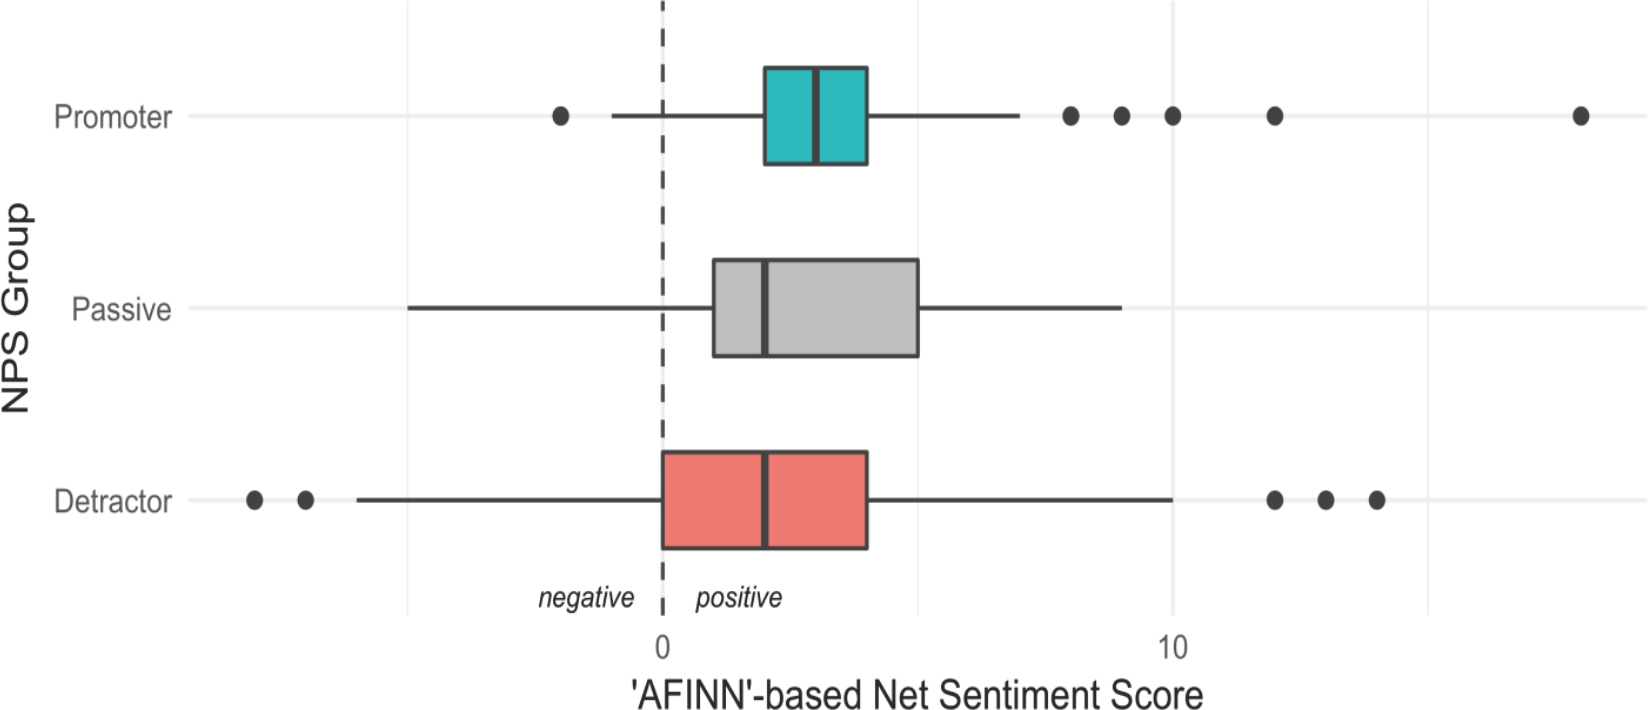
Figure 5. Distribution of comment sentiment scores for employee satisfaction with a non clinical support department, by NPS grouping.
Another way to explore word frequencies between groups is by looking at differences between term frequency-inverse document frequency (tf-idf). This method looks at both frequency of occurrence across the groups generally (the tf part), as well as how common these same words are across documents within each group (the idf part). Basically, it suggests how important a given word is to the given grouping, or similarly provides sets of words that distinguish one group of text from another. Using this method, top terms can be visualized against each other, as seen in Figure 7, which shows the top 10 tf-idf terms by location.
Cosine similarity is another way to quantify the degree of difference between two text groups, values closer to 1 reflect similarity in word use between groupings, and values closer to 0 reflect strong differences. The cosine similarity for comments grouped by location is 0.94, indicating that the word distributions within comments from each location are nearly identical.
As with all of the day-surgery comments’ text mining results, none of the results shown above came as any surprise to senior or local leaders.
Ethnographic results
Ethnography: Topics/Themes – Ethnographic investigation identified how much distress the pager and communication process during surgery were causing to both parents and staff. The delay in communication was a very nerve-racking experience for all caregivers; several parents relayed stories of being paged much earlier than expected, even only 4 hours into an 8-hour procedure. After receiving the page, families proceed through an extensive process with multiple delays to speak with a provider. In each case when caregivers spoke about this process and lag in communication, they mentioned that while the outcomes for their child were positive, the stress and tension they felt when left waiting was burdensome.
Caregivers also reflected on feeling lost in the system on the day of surgery, amid managing their child’s fear and anxieties as well as their own. Once leaving their child in the surgical suite, parents are left alone in the back halls of the hospital: unsure where to go, what do to, or who to go to if they have a question. Family members often wouldn’t leave the surgery waiting area, fearful that the pager wouldn’t work, or someone wouldn’t be able to get a hold of them, even though they need a place to decompress after saying goodbye to their child.
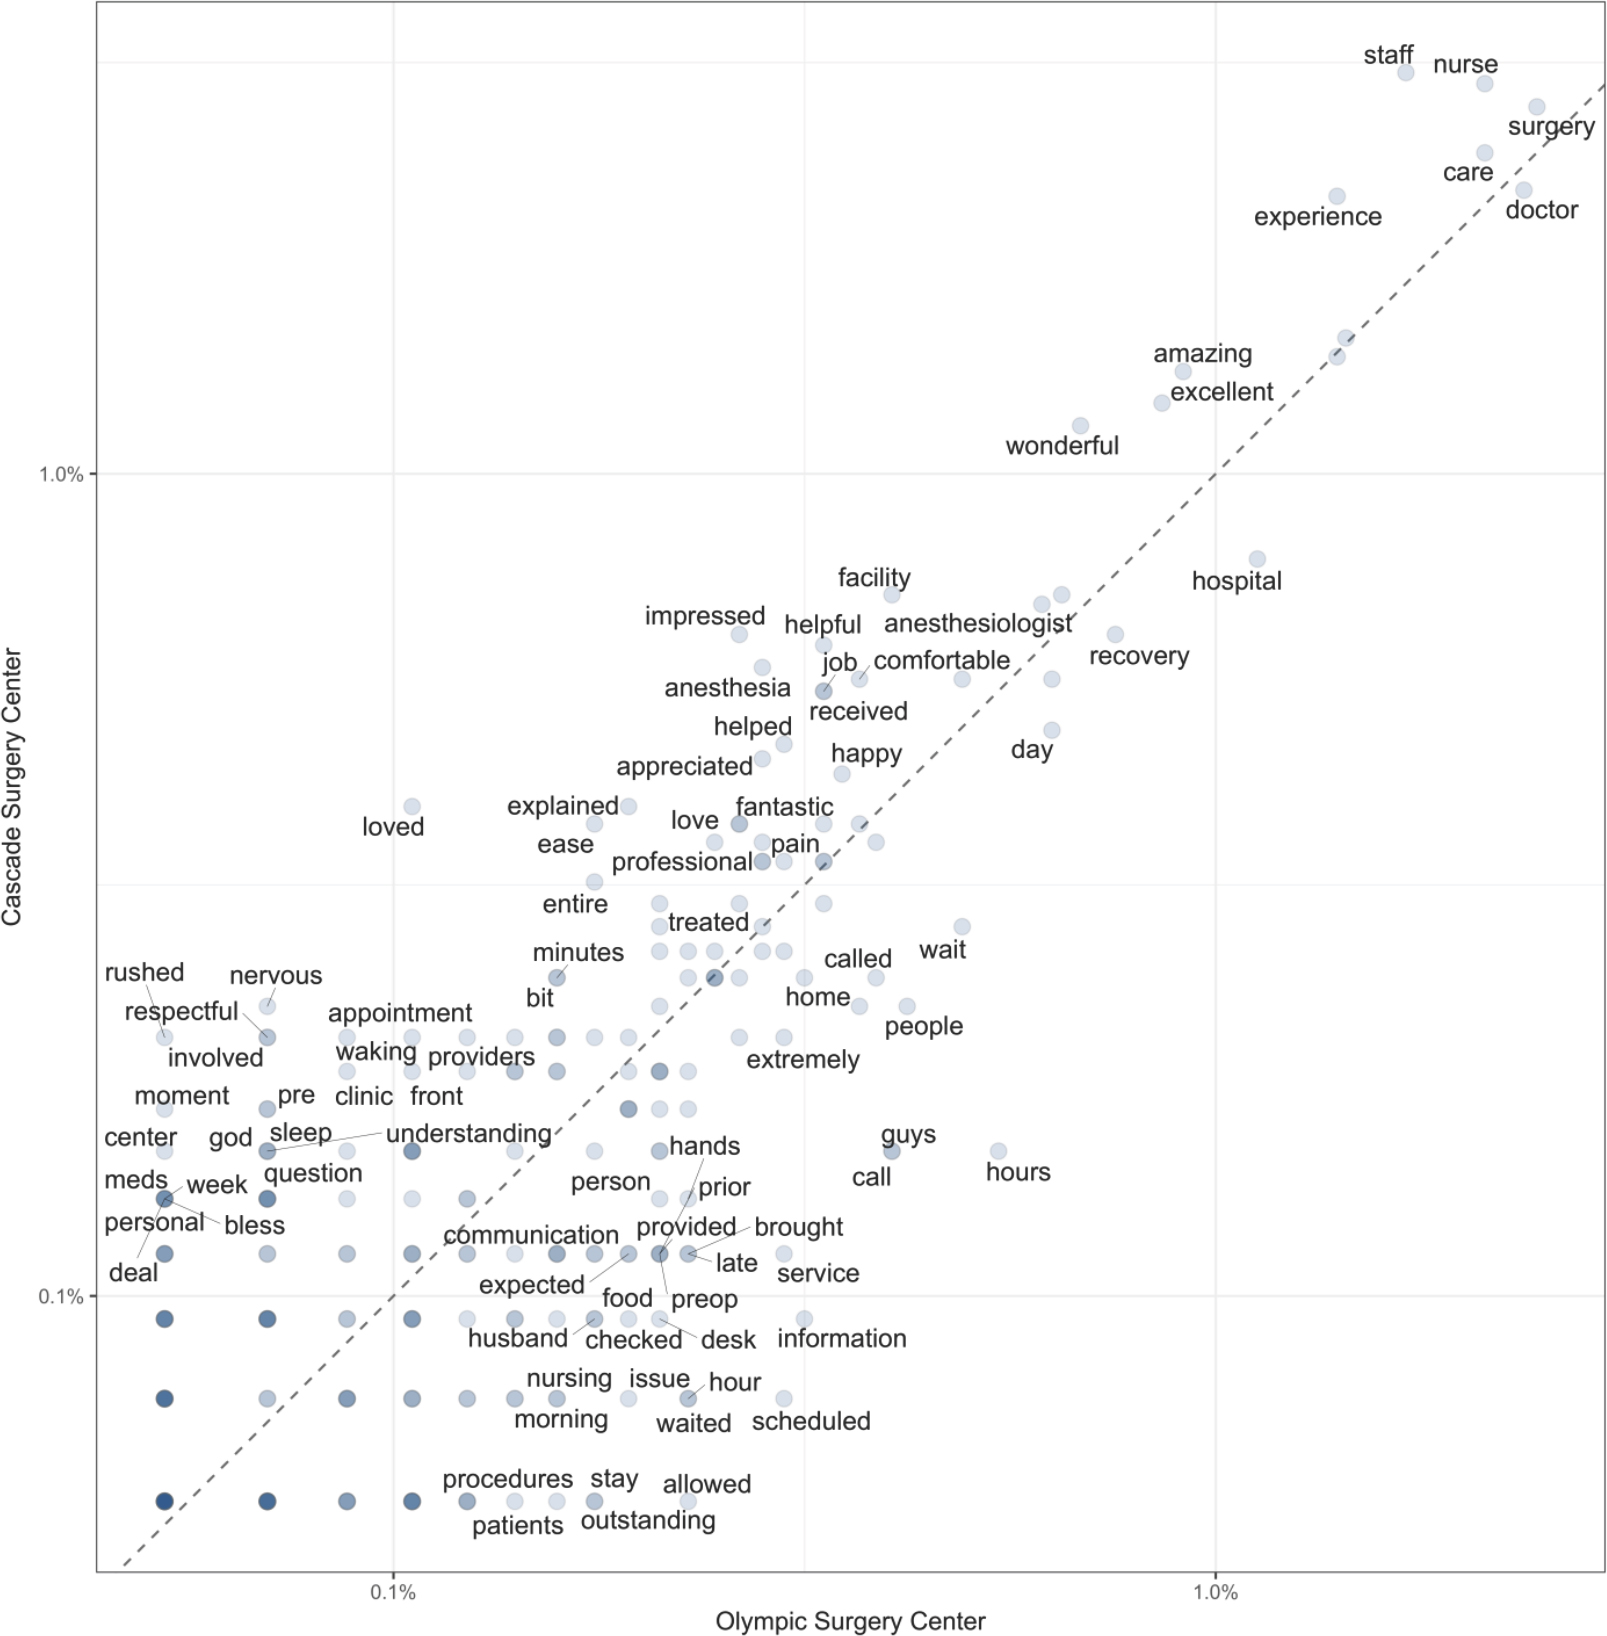
Figure 6. Differences in word frequency between day-surgery locations. For purposes of clarity, not all term labels are plotted. The axes are log-scaled occurrence frequency, the 1:1 line represents the line of equal frequency, and the darkness of the point represents the number of unique words that have the same frequency + location characteristics. The further from the diagonal a word is, the more frequently it appears in one location’s comments relative to the other location.
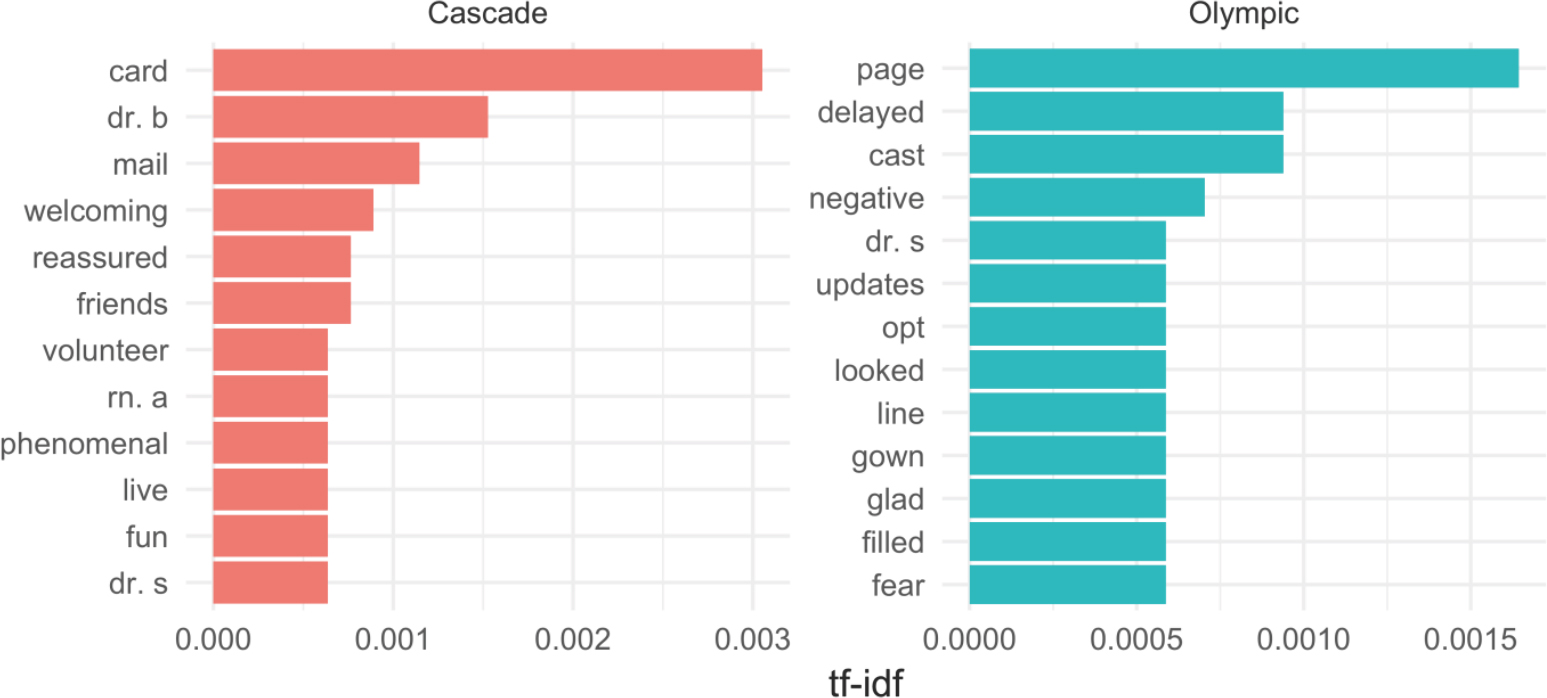
Figure 7. The top 10 highest tf-idf words by day-surgery location. Nurse and doctor names are anonymized.
In turn, staff struggled to know when or what was communicated to families, usually relying on nursing documentation that was frequently delayed because documentation necessarily follows actual care events. Staff deeply wanted to address family concerns, but acutely felt the competing needs of patient care, process flow, and team and family communication. These insights were not revealed with any other method and findings from this work created clear understanding into the problem at hand and the motivation to seek workable solutions.
Ethnography: Sentiment – Ethnographic work in the hospital setting has also revealed a tension about delivering constructive criticism to providers and the organization. Often, caregivers are so grateful for the services and positive outcomes that they are hesitant to speak negatively about any aspect of the service. Thus, ethnographic work in hospitals must recognize the vulnerable position of its informants, relying heavily on observations, qualitative interpretation, and family advisors who are in the role of advocating for better experiences. Given the delicate relationship between caregivers and clinicians, work that can capture the trials and suffering of patients and caregivers becomes all the more critical.
In the case of day-surgery, caregivers retrospectively described strong negative emotions, including distress, feeling lost, lack of control, and fear, despite the fact that the outcome for their child was positive. Ethnographic work uncovered how the communication process contributed to these negative emotions: while ethnographic sentiment was not quantifiable or identified as inherently positive or negative, the connection to deeper human emotions created a stronger sense of urgency to solving this problem. By understanding the trauma unintentionally generated through the communication process, prioritization and actionable insights to make improvements were clearly identified.
Ethnography: Comparing Locations – Ethnographic work throughout the hospital and different day-surgery locations has led to findings that span many settings and directly impact patient, family, and staff experiences. First, clinical team dynamics, including shared physical space, interpersonal relationships, and staffing support, all play a central role in their perceived effectiveness by patients and families. Often, changes made to improve patient flow (e.g., medical assistants sitting together so they can efficiently room patients instead of with the rest of the clinical team) impeded staff relationships by creating a less cohesive environment. Awareness of the trade-offs in improvement efforts and their impact on patient and staff experience may need re-evaluation, especially given staff burnout from initiative fatigue and constantly shifting priorities (Briody 2018).
In addition, patients and parents wanted their providers and teams to “know them” and feel “met” where they are, not where institutional habits placed them. Needing to be known and met arose in a variety of interactions: understanding their medical and social history, personal preferences, navigating the medical system, individualized resources and treatments plans, as well as confidence that staff at every step knew what they needed so they didn’t have to keep retelling their story. From these insights, ideas about how to incorporate the lifeworld not only into clinical but also administrative systems were identified. Observations showed how the available tools and systems continually impacted the clinical team’s ability to address the lifeworld. For example, one clinic’s providers were consistently overbooked and scheduled out too far to see acute patients in the needed timeframe. The providers were frequently recommending that patients get on a waiting list to be seen for timely treatment, only to discover much later that such a list did not actually exist. Thus, the deeper insights from ethnography shed light on assumptions, contextual nuances, and social dynamics that directly impacted satisfaction and experience. By understanding such insights, actionable recommendations for local leaders become possible, meeting the stakeholder’s requests for meaningful evidence.
DISCUSSION
Different analytic methods necessarily lead to different insights. While both qualitative and quantitative analytic professions hold that as a truism, it is less well appreciated or understood in management. As seen above, each methodological approach provides different views and interpretations of the survey comment results, which can subsequently result in different business interpretations and thus different action recommendations. Essentially, stakeholders need to understand best use cases for each method; the critical role of an analyst is to help them explore the trade-offs before too much time, money, and effort are invested in an approach that doesn’t meet leaders’ primary needs. A side-by-side evaluation of each method relative to the survey comment data (Table 5) helps illustrate how different approaches to satisfaction problems and data might not deliver the attractive results stakeholders were looking for and could even lead to misinterpretation of patients’ and caregivers’ key needs, with corresponding impacts on the business and bottom line.
Text mining struggles to identify actionable themes, accurate sentiment, or group distinctions that are readily identified by both content analysis and end users
It is clear from the results that text mining fails to achieve what leaders were hoping for—a quick, quantifiable way to justify prioritizing satisfaction improvements. Instead, it was unable to provide any insights not already obvious to the end users.
Table 5. An example of how different methods can lead to different conclusions and business implications from day-surgery satisfaction comment analysis results.
| Content Analysis | End User Reading | Text Mining | Ethnography | |
|---|---|---|---|---|
| Insight Differences | Wait times, being with child in recovery room and comforting the patient should all be improved at the Olympic location. | Wait times, recovery room, and comforting the patient. | Work on wait time, but both locations seem the same. | Communication process including pagers, team communication and visibility into family communication. |
| Business Interpretation | Olympic should focus on improvements Cascade has made – e.g., more TV monitors for status updates, volunteer program, & get-well cards. | Find new ways to improve wait times. Allow parents into recovery room. | Find new ways to improve wait times. | End-to-end process redesign focused on creating less traumatic experiences, while also improving communication amongst staff and families. |
| Best use case | When there are <1,000 comments. To confirm what leaders/ stakeholders already know, unless nothing is yet known. | When there are <1,000 comments. To identify opportunities and how they relate to other sources of data and evidence. | When there are 1,000+ to tens of thousands of comments and a need to classify or identify the most common themes. | When it is unclear what to prioritize, to identify how human behavior, values, or emotions in specific contexts influence experience. When needing innovation or inspiration. |
The example of sentiment analysis in particular shows that the problem can be deeper than lack of insight production, as well. While there was a weak trend in sentiment level for the employee NPS survey that showed more positive sentiment linked with higher scores, there were enough notable exceptions that showed the peril inherent to assuming that the aggregate results indeed reflect the underlying sentiments of the respondents. For example, one comment scored up among the most positive sentiment scores of the entire survey. The text of that comment belies the positivity of that score:
… staff on night shift are not very helpful or nice. They act like we are bothering them rather than being there to help. Frequently they don’t help because they can’t figure out what problem you have. It used to be called the “help desk” and when someone suggested calling the “help desk” we would all laugh. Just being nice would help out considerably. Customer service…
In fact, this respondent had given the department an overall NPS score of 0, the worst possible rating. The reason the sentiment was rated so positively by the algorithm makes sense when one recalls that the sentiment score is based on the sum of the sentiment of the individual words. Thus, words like “helpful”, “nice”, and “laugh” all contributed positive values (given the lexicon used), while words like “bothered” and “problem” did not subtract from that overall score. This highlights the importance of understanding not just the data but how lexicons are built and applied to understand whether a sentiment analysis is accurate.
As this example shows, automating sentiment analysis is extremely problematic. Do the quantitative sentiment values accurately reflect the qualitative assessment of the same data source? How would one know? Conversely, is it worth the time to have a human-run sentiment assessment done to get a sense of positive versus negative comments frequency, or does the satisfaction KPI score provide enough information? In short, the idea of sentiment analysis brings to light an important but hidden consideration: strictly from an ROI point of view, are the comments actually important?
From an incentive point of view, improving a summary score for 0-10 Likert scale-based KPIs would likely focus on moving 7s and 8s up into the 9s and 10s. More people, with fewer strong complaints (if any) are in this category than those who score <7, and it would certainly be easier to address those respondents’ needs as a means to improve KPI scores, if only to nudge them up a single point in their ratings. For example, in the employee satisfaction survey, the most common complaint amongst the 8s involved requests for modernizing their tools, while those who scored <7 focused on deep, difficult problems such as pay scales, skill sets, siloed responsibilities, and gatekeeping issues. While the best improvements to actual conditions would be focus on those <7s, it’s far easier to do things like updating tools, which is more likely to create discernable changes in subsequent KPI scores. Additionally, the conceptual constructs behind the surveys’ scores may not correlate at all with the complaints voiced in the free text responses, leading to differing implications on what should be done—raising survey scores and addressing complaints may be mutually exclusive activities under resource-limited conditions.
Content analysis cannot fully account for the lifeworld, and priorities should be on meaning, not substitutes for thinking
While content analysis yielded much more meaningful results than text mining for day-surgery feedback across the board, the anthropologist still had reservations as to whether it was providing accurate or useful results for leaders to act upon. Satisfaction comments can relay elements of what an individual liked or didn’t like about a service or experience yet meaning and emotions play a key role in the contextual analysis of that experience (Sword et al. 2017).
The subjective nature of an experience itself coupled with the “inexhaustible capacity of language to describe affect” makes analyzing such comments using content analysis fraught with gaps in evidence (Sword et al. 2017:4). In the following comment, “beg” and “blown off” illustrate how adverse the lack of communication and concern were for this parent:
The doctors and some nurses were amazing. We were scheduled for surgery @ 3:45 pm yet didn’t have surgery until 7:30 pm. We had to beg for information. We were blown off a few times until a wonderful nurse, not assigned to us, took over and stayed with us. The surgeon was great.
Yet, when coded, these striking metonyms are hidden by bland terms such as “wait times”, “communication”, and “addressed concerns”, which leaves out the powerful words that could be the motivation and understanding a team needs to act. In the case of content analysis, the lifeworld is understood by the coders but is easily lost when translated into institutionally-understood categories.
Consequently, while an inductive analysis is useful, coding is also rife with subjectivity that forces the coder to prioritize organizational understanding over emotional complexity. This is not to say that content analysis does not have its place. If general but operationally useful categories of feedback are needed, content analysis would be perfectly suited to provide that information and content analysis provided some lifeworld-led concerns for further exploration. However, considering the requests from stakeholders that include asks for not only the what, but also the why and how they should improve, other methods like ethnography and direct input from patients and families are better suited to begin answering such questions. An analyst would be rightly hesitant to recommend that interventions should be created solely based on evidence from content analysis results.
The low yield of meaningful or hidden insights from both content analysis and text mining made the authors wonder, what was the underlying reason for these analytics requests? Since stakeholders felt that these were both valid requests, the question becomes whether monitoring and analyzing data simply because it is available is a good use of time and money. Given that end user reading can provide the highest likelihood of increasing KPI for the least amount of time and expense, leadership’s belief that text analyses can provide meaning and context becomes more apparent. Based on identifying this assumption, the authors recommended that stakeholders should prioritize deep meaning and sensemaking rather than focusing energy on poor substitutes.
Ethnographic work found deeper meaning yet failed to strongly influence decision making
For pediatric populations, more understanding and integration of social, economic, and familial context than adult populations is required for clinicians to make recommendations that both treat the condition as well as satisfy the patient and their family. In fact, a study of diabetic children showed that they want to be more involved in their care—often with the support of a parent or guardian since diabetes care is complex. However, the degree of these children’s interest in involvement varies, and they did not want a one-size-fits-all approach (Ekra et al. 2015). Regardless, clinicians are asked to operate within a system that seeks to standardize everything from treatments and clinical notes to safety measures. Until the entire operational context—from appointment to billing—can also incorporate lifeworld-led care, clinicians will continue to face obstacles that impede their ability to treat their patients, continuing the cycle of provider “moral injury”, decreased staff engagement, and decreased patient satisfaction (Talbot and Dean 2018).
Ethnographic studies of the patient experience at Seattle Children’s yielded useful and important results. Yet, since insights based in empathy and emotions encourage innovation and potentially fundamental changes to current business models, they are often seen as disruptive. In addition, patients and families respond through the context of their lived experiences, rather than through a “controlled experience” (i.e., objective feedback about singular elements of an encounter) that the teams would prefer. Indeed, the issues that present themselves from ethnographic work often require teams to approach their work differently all while leveraging limited resources. When this occurs, there has been a tendency to dismiss the qualitative evidence for various reasons, not dissimilar to what ethnographers in other industries have experienced, such as n-size, sampling strategy, questioning the validity of interview questions and responses, arguing the information is too complex to be useful or suggesting that the issues are too large to tackle (Dourish 2006; Flynn & Lovejoy 2008; Ladner 2014). Tellingly, these ethnographic projects have been least successful when the findings do not have a direct impact on immediate business goals, such as findings that are difficult to implement immediately, such as changes to the medical records system. Additionally, teams might not be prepared to act on the data. For example, a team was prepared to address patient expectations but would need administrative support and escalation to address technology issues. Finally, ethnographic findings struggle to take hold when new organizational initiatives supersede the initial request (Briody 2018). A bias towards quantitative evidence is implicit, with its clean, easily understood format that can be neatly placed in improvement work and measured (regardless of the reality underpinning that belief), despite end users continuing to ask for meaning in analytic results. Yet, ethnographic findings provide the innovative solutions that will be necessary to reorient healthcare’s service delivery model.
Data analysis requests in silos can lead to poor insights
While the content analysis suggested that Cascade was better at meeting lifeworld-based needs through interactions with staff, setting clearer expectations, and sending a follow-up note to the patient after surgery, the leadership team also cited several recent changes—like putting up a surgery progress monitor in the waiting rooms and having volunteers available to stay with families—that they felt had improved their score (see Table 2). This perception led the analysts to initially believe that perception of wait times was better at Cascade because of these changes and was therefore increasing their KPI scores. In fact, Olympic surgery center leadership has been adopting each of these practices based on this perceived success. A quick review of surgery start times found that Olympic’s starts have been about 30 minutes later on average over the same time period as the comments, and that neither location shows any change in actual wait times. While Olympic does see a more acute patient population, this delay remained even when accounting for case acuity. In fact, Cascade and Olympic’s start times trends only diverged for the lowest case acuity level. Thus, whether the other interventions were useful or not, Olympic has other issues that cause delays, perhaps separate from any actual or perceived improvement based on implementing Cascade’s interventions. The implication here is that relying on survey comments alone can cause inaccurate interpretation and resources spent inefficiently.
Finding return-on-investment (ROI) likely requires exploring return-on-method (ROM) first
The case of sentiment analysis in particular shows some of the problems associated with these methods: text mining is fast and easy but inaccurate, while content analysis is more accurate but takes considerably more time. In regard to themes, content analysis can only provide partial insights, leading to misinterpretation. While text mining is comparatively more objective, it struggles to find any but the most superficial meaning from this type of homogenous comment data and can even be outright wrong. Further, even presumably objective quantitative analyses in text mining are exposed to subjective whims of the analyst, such as the threshold at which to set word correlations, the lexicon used for sentiment scoring, or the number of latent topics to assign an algorithm to find.
When considering stakeholder needs and the complexity of their roles as leaders, highlighting the ways various methods may or may not inform their needs is critical to helping them make productive decisions. With the internal satisfaction survey, the data scientist was able to show stakeholders through simple examples how text mining the comments would not produce the requested results. Based on their shared experience addressing their two requests, the authors compiled a list of qualities each method contains, so that stakeholders can constructively consider what forms of evidence might be valuable to them (Table 6; Figure 8).
Table 6. Comparison of four approaches to eliciting meaning for text data.
| Qualities of Methods | Text Mining | Content Analysis | Ethnography | Reading (by end user) |
|---|---|---|---|---|
| Fast | Yes | No | No | Yes |
| Degree of quantification | High | Medium | Low to none | Low to none |
| Probabilistic | Yes | Can be | No | No |
| Quantity of data | Large (101-109) | Small/Medium (101-104) | Small (100-101) | Small/Medium (100-102) |
| Ability to scale | Yes | No | No | No |
| Ability to automate to end user | Yes | No | No | Yes |
| Frequency of access | Continuous | 1x/year | Dependent on length of fieldwork | Continuous |
| Ease of results interpretation | High | Medium | Low | High |
| Resource / time burden | Analyst | Analyst | Analyst + end user | End user |
| Lifeworld | No | Low | High | Medium |
| Insights | Doubtful | Some | Yes | Casual |
| ROM | Low | Medium | High | Medium |
Table 6 (above) provides some specific attributes of each methodological approach, with particular attention to the qualities that make text mining seem desirable. Figure 8 (below) provides a more general sense of the trade-offs between these approaches; much like the “project manager’s triangle”, you can’t simultaneously maximize all desired analytic qualities.
These heuristics helped the authors articulate qualities of interest for stakeholders, as there are clearly significant trade-offs in requesting certain attributes for analytic response. For example, text mining can be done very quickly, but will not likely provide useful insights for this type of data; when the spread of topics and themes is minimal (as is typical in survey-based free-text responses), content analysis will be more accurate yet more expensive than text mining. Comparatively, ethnography can provide the depth of knowledge and actionable results that stakeholders are usually looking for, but at the cost of considerably greater time and effort. Finally, having the end users read the comments can perhaps accomplish much of what leaders need to understand from that data source, albeit only if they can set aside a bias towards quantification and be honest about their own subjective contexts (Gilovich 1991; Croskerry 2002; Kahneman 2011; Mannion & Thompson 2014).
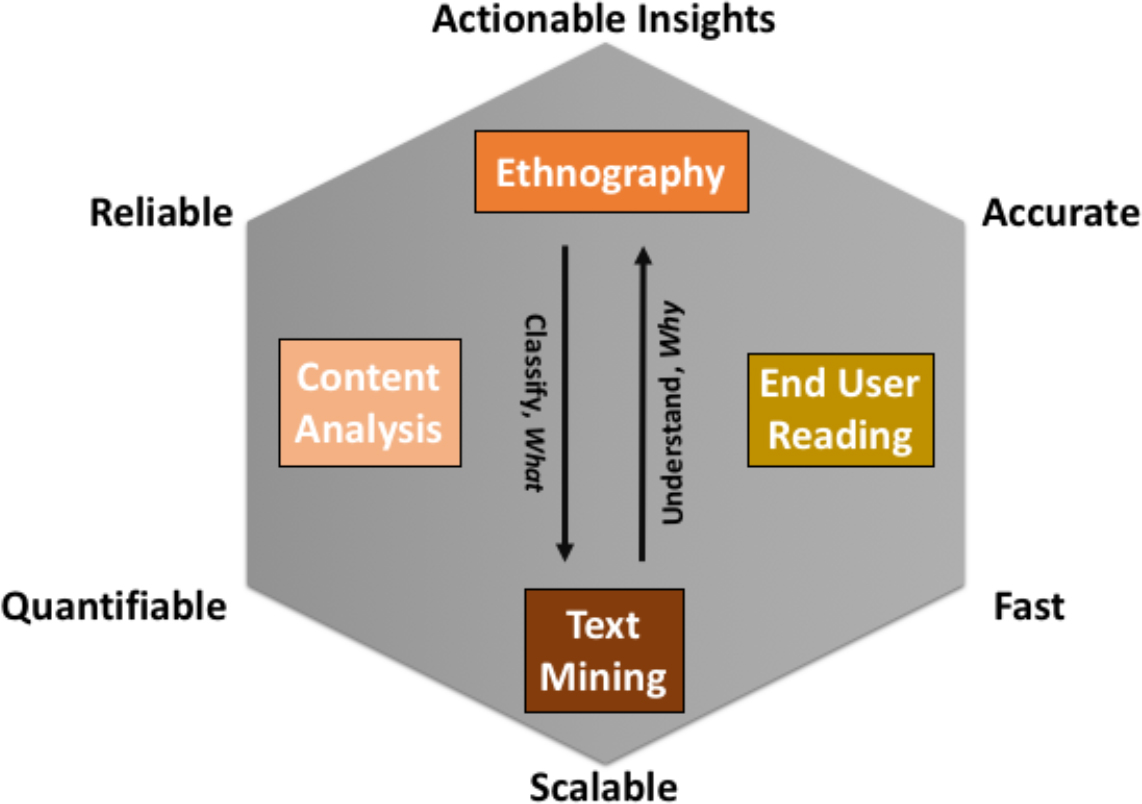
Figure 8. A conceptual summary of the tradeoffs between the various methodological approaches to understanding patient satisfaction comment data.
When the goal is to get a general sense for what patients, families, or staff are saying, the authors have recommended that the end users should just read the comments themselves. Given that they are content experts for their areas of leadership, they should readily understand how this source of feedback relates to the multitude of data sources they review. Because ethnography takes time and survey response analyses are not a high priority for that method given other hospital needs, having the end user read the comments provides the most insight (that’s relatively gleanable from survey comments) for the least amount of effort, time, and cost to the organization. The caveat to this is that it does require a shift of the time and critical thinking burden back to leadership; if leadership instead delegates that task to other managers to find information within comment data, they would simply be replacing trained content analysis with untrained content analysis, where results could be left open to possible inadvertent bias, political spin, or siloed interpretations.
Data or information requests are often given to analysts in a vacuum, with little time or scope to seek additional information that could provide better context and understanding. When the results do not match what stakeholders expect, either duplicative requests are made to see if differences can extract more meaning, or the ability of the analyst is put in question. Thus, analysts and ethnographers alike are left grasping at straws to deliver results and evidence by a deadline. It is up to analysts and ethnographers to push back and leverage ROM to explain why certain sources of data or analysis methods will not provide the evidence stakeholders need. To usefully achieve ROI, analysts should hold stakeholders accountable for their requests and provide them with an understanding of the possible risks of such labor: wasted time and effort for both the analyst and the improvement teams, potentially misguided recommendations, and low staff engagement if/when these efforts fail.
ReHumanization: Lifeworld-led care and the search for meaning
While researchers of the lifeworld concept have focused on the interaction between medical care and the lifeworld, by offering linkages between these two sets of incongruent meaning systems or by suggesting implications for broad public health policy, very little is understood about the downstream effects of the lifeworld on operational, administrative, and business decisions (Barry et al. 2001; Lo 2010; Ekra et al. 2015; Dahlberg 2009; Hemingway et al. 2011, 2012). As society compels a shift from the traditional medical model of illness and treatment, to concepts such as personalized medicine, upstream impacts on social determinants of health and communities, as well as new sources of automated data tracking, lifeworld-led care must be increasingly recognized to ensure experience and satisfaction don’t decline. Yet, the ability to communicate effectively with the lifeworld is impeded when the logics and rationality of the medical system (in this case, organization and hospital culture) are normalized and supersede other ways of communicating (Habermas 1984). Busy stakeholders may feel that they do not have time for the lifeworld, that a claim to statistical significance is enough to make decisions, despite the serious inferential problems with that approach (Simmons et al. 2011; Ruzzo 2014). Ethnographers are often asked to prove their findings by emphasizing the quantity of their sources whether in terms of number of individuals who were interviewed and contributed to data or the volume of data collected (Kelley & Buchanan 2017; Ladner 2014), so a bias towards frequencies and statistical significance in prioritizing information still prevail as key decision-making strategies.
Currently, the complexity of the US healthcare system and the long-ingrained decision-making hierarchy in medicine enforces behaviors that prioritize institutional knowledge over the experiences of patients, families, and staff, which in turn can lead to stagnant or decreased satisfaction. From the patient, family and clinician perspective satisfaction survey data is met with skepticism given that a week in the hospital with rotating care teams are distilled into a single satisfaction score. Experience and satisfaction analysis work, rather than taking the approach of KPI monitoring, needs to be grounded in the lifeworld concept, explicitly including empathy for patients, families, and staff. Human-centered methods that are focused on putting patients at the center of the process, have been recently introduced in healthcare, and may provide a lens through which to include the lifeworld (McCreary 2010).
Addressing patient experience and satisfaction requires dealing with samples of one as well as samples of millions. We can sometimes humanize single comments, and even occasionally topics and themes, by linking those with our own experiences and expectations. However, making strong inferences from small n’s necessarily requires an approach that counterbalances big data with “thick data” while also maintaining a view of the lifeworld (Wang 2013; Habermas 1984). Transferring the lifeworld to ever-increasing amounts of text data, which by necessity become dehumanized through aggregation, is a challenge for which there are not yet any algorithmic solutions. Arguably, there may never be. So rehumanizing massive amounts of personal data may also require collaboration with ethnographers who can turn stories into evidence all while eliciting unstated assumptions and biases in stakeholders’ beliefs to achieve the results leaders expect. Therefore, ethnographic approaches will need to provide windows into patients as well as leaders’ lifeworlds.
To create sustained KPI improvement, addressing deep-rooted issues in the medical system are necessary—and ethnographic findings are perfectly situated to support such efforts. It is also possible that ethnographic insights in combination with text mining could eventually provide leaders with both meaning and scores, but this ideal has yet to be realized in any industry. In healthcare, understanding lifeworld-led care in the context of an industry that is increasingly paid for—and expected to be—in the business of service delivery will be critical to influencing long term experience and satisfaction outcomes.
CONCLUSION
This case study exemplifies how collaboration between a data scientist and an anthropologist helped test different methods to address the best way to tackle a tricky problem—improving healthcare satisfaction. Through discussions of their methods, they learned about the inherent biases of each other’s approaches and can speak to a wider range of different disciplines’ approaches to text analysis. The benefit of shared knowledge means that they can be clear from the beginning about what sorts of results stakeholders can expect to see, saving time and energy otherwise spent on analyses that may not yield the expected results.
This effort required that they also unravel their organization’s cultural seams to understand why and how decisions are made, as well as how their work is impacted by organizational assumptions. Using an ROM approach, analysts can make informed recommendations to busy stakeholders and allow them to choose which qualities of data they are willing to compromise (or not). The recognition of where biases in data and analyses occur, as well as understanding the impact on insights, allowed the authors to carefully consider their recommendations to leaders, as well as their own approaches in developing those recommendations.
Analysts internal to an organization are typically expected to follow through on data requests with little-to-no say about the validity in doing so. While they may be aware of internal biases, it can be difficult to articulate their impact on day-to-day operations, especially to busy stakeholders who may see push-back as contesting their leadership. An awareness of organizational assumptions and prioritization allowed the authors to carefully construct a narrative that is less threatening to any individual (or the organization) but still highlights the strengths and weakness of each method. Consequently, the internal practitioner’s role is not only to perform the requested assignments but to also advocate for the modes of evidence that will be most accurate, meaningful, and useful. Analysts are not victims of their stakeholder’s requests—they must push back on bad assumptions and hold leaders responsible for their decisions in both developing KPIs and in making resource-intensive analytic requests.
As the healthcare industry moves towards a value-based care focus, requests for data around satisfaction and experience will only increase. Work meant to improve experience and satisfaction for hospital patients, their families, and employees must consider how each individual’s contextually-grounded lived experiences inform their perceptions of any encounter. In short, the command-and-control methods used in healthcare to save lives will not likely be successful in improving experience and satisfaction; essential safety tools like checklists and standardization necessarily require prioritizing institutional support, language, and meaning (Conley et al. 2011) over the voice of the lifeworld (Habermas 1984). Data analysis that also prioritizes the system’s biases towards statistical significance, data science hype, and reporting structure silos will similarly not provide useful evidence for improving experience and satisfaction. A shift from efficiency-based analyses for improvements to human-centered efforts will require organizations to better understand their patients and staff through carefully collected empathy and cautious, well-informed consumption of both qualitative and quantitative evidence.
Julia Wignall, MA, is an Anthropologist at Seattle Children’s Hospital and a Qualitative Researcher at Seattle Children’s Research Institute in Seattle, Washington, USA.
Dwight Barry, PhD, is a Principal Data Scientist at Seattle Children’s Hospital in Seattle, Washington, USA.
NOTES
Acknowledgments – We’d like to thank Katelyn McLaughlin, as well as the rest of our patient experience and clinical analytic teams, for their contributions and permission to be part of this project. Chad Maxwell of Kelly Scott Madison; Aaron McAdie, Libby Montague, Andy Cooper, PhD, Ryan Sousa, Harris Baden, MD, Stephanie Hillman, Jenny Davidson, Joy Gehner and Jenn Scott of Seattle Children’s Hospital; Tami Barry, PhD, of Western Washington University; and Evan Smith, DMA and Seattle Children’s IRB all provided valuable feedback that improved this paper considerably. The views expressed in this paper are those of the authors, and do not represent the official position of Seattle Children’s Hospital.
REFERENCES CITED
Azam, Kamran and Anwar Khan and Muhammad Alam
2017 Causes and Adverse Impact of Physician Burnout: A Systematic Review. Journal of the College of Physicians and Surgeons Pakistan, 27(8), 495-501.
Baer, Tamara and Angela Feraco, Selin Sagalowsky, David Williams, Heather Litman, and Robert Vinci
2017 Pediatric Resident Burnout and Attitudes Toward Patients. Pediatrics, 139(3), e20162163.
Balik, Barbara and Jim Conway, Lori Zipperer, and Joanne Watson
2011 Achieving an Exceptional Patient and Family Experience of Inpatient Hospital Care. IHI Innovation Series white paper. Cambridge, Massachusetts: Institute for Healthcare Improvement.
Banks, George and Haley Woznyj, Ryan Wesslen, and Roxanne Ross
2018 A Review of Best Practice Recommendations for Text Analysis in R (and a User-Friendly App). Journal of Business and Psychology, 33(4), 445-459.
Barry, Christine Ann and Fiona Anne Stevenson, Nicky Britten, Colin Bradley, and Nick Barber
2001 Giving Voice to the Lifeworld. More Humane, More Effective Medical Care? A Qualitative Study of Doctor-Patient Communication in General Practice. Social Science & Medicine, 53, 487-505.
Bodenheimer, Thomas and Christine Sinsky
2014 From Triple to Quadruple Aim: Care of the Patient Requires Care of the Provider. Annals of Family Medicine, 12(6), 573-576.
Briody, Elizabeth
2018 The Woes of Implementation Practice: Getting Caught by the “Program of the Month”. Journal of Business Anthropology, 7(1), 98-132.
Conley, Dante and Sara Singer, Lizabeth Edmondson, William Berry, and Atul Gawande
2011 Effective Surgical Safety Checklist Implementation. Journal of the American College of Surgeons, 212(5), 873-879.
Croskerry, Pat
2002 Achieving Quality in Clinical Decision Making: Cognitive Strategies and Detection of Bias. Academic Emergency Medicine, 9(11), 1184-1204.
Dahlberg, Karin and Les Todres and Kathleen Galvin
2009 Lifeworld-Led Healthcare is more than Patient-Led Care: An Existential View of Well-Being. Medicine, Health Care and Philosophy, 12(3), 256-271.
Dourish, Paul
2006 Implications for Design. CHI 2006 Proceedings. Montreal, Quebec, Canada.
Ekra, Else Mari Ruberg and Tora Korsvold and Eva Gjengedal
2015 Characteristics of Being Hospitalized as a Child with a New Diagnosis of Type 1 Diabetes: A Phenomenological Study of Children’s Past and Present Experiences, BMC Nursing 14(4), 1-10.
Flynn, Donna and Tracey Lovejoy
2008 Tracing the Arc of Ethnographic Impact: Success and (In)visibility of Our Work and Identities. Ethnographic Praxis in Industry Conference Proceedings, 2008(1), 238–250.
Gilovich, Thomas
2008 How We Know What Isn’t So. New York: Simon and Schuster.
Habermas, Jürgen
1984 The Theory of Communicative Action: Reason and the Rationalization of Society. Boston, MA: Beacon Press.
Hemingway, Ann
2011 Lifeworld-led Care: Is it Relevant for Well-being and the Fifth Wave of Public Health Action? International Journal of Qualitative Studies on Health and Well-being, 6(4), 1-7.
Hemingway, Ann
2012 Can Humanization Theory Contribute to the Philosophical Debate in Public Health? Public Health, 126(5), 448-453.
Husserl, Edmund
1936 The Crisis of European Science and Transcendental Phenomenology. Evanston: Northwestern University Press (reprinted edition, 1970).
Institute of Medicine
2001 Crossing the Quality Chasm: A New Health System for the 21st Century. Committee on Quality of Health Care in America. Washington, DC: National Academies Press.
Ioannadis, John
2005 Why Most Published Research Findings are False. PLoS Medicine, 2(8), e124.
Kahneman, Daniel
2011 Thinking, Fast and Slow. New York: Farrar, Straus and Giroux.
Kelley, Beth and Jennifer Buchanan
2017 The Lifecycle of a Washing Machine: Transforming the Customer Experience for a Home Appliance Manufacturer. Ethnographic Praxis in Industry Conference Proceedings, 2017(1), 458-476.
Ladner, Sam
2016 Practical Ethnography: A Guide to Doing Ethnography in the Private Sector. Routledge, NY: Taylor & Francis Group.
Lagasse, Jeff
2017 As Chronic Illnesses Drive Up Healthcare Spending, Solutions Focus on Wellness, Interventions. Healthcare Finance website. October 24, 2017. Accessed [July 9, 2018]. https://www.healthcarefinancenews.com/news/chronic-illnesses-driving-healthcare-spending-solutions-focus-wellness-interventions
LaVela, Sherri and Andrew Gallan
2014 Evaluation and Measurement of Patient Experience. Patient Experience Journal, 1(1), 28-36.
Lo, Ming-Chen Miriam
2010 Cultural Brokerage: Creating Linkages Between Voices of Lifeworld and Medicine in Cross-Cultural Clinical Settings. Health, 14(5), 484-504.
Mahan, John
2017 Burnout in Pediatric Residents and Physicians: A Call to Action. Pediatrics, 139(3), e20164233.
Mannion, Russell and Carl Thompson
2014 Systematic Biases in Group Decision-Making: Implications for Patient Safety. International Journal for Quality in Health Care, 26(6), 606-612.
McCreary, Lew
2010 Kaiser Permanente’s Innovation on the Front Lines. Harvard Business Review, 88(9), 92–97.
Nuzzo, Regina
2014 Scientific Method: Statistical Errors. Nature, 506 (7487), 150–152.
R Core Team
2017 R: A Language and Environment for Statistical Computing. R Foundation for Statistical Computing, Vienna, Austria. https://www.R-project.org/
Reichheld, Frederick
2003 The One Number You Need to Grow. Harvard Business Review, 81(12), 46-55.
Simmons, Joseph and Leif Nelson and Uri Simonsohn
2011 False-Positive Psychology: Undisclosed Flexibility in Data Collection and Analysis Allows Presenting Anything as Significant. Psychological Science, 22(11), 1359-1366.
Sword, Helen and Marion Blumenstein, Alistair Kwan, Louisa Shen, and Evija Trofimova
2017 Seven Ways of Looking at a Data Set. Qualitative Inquiry, 24(7), 1-10.
Talbot, Simon and Wendy Dean
2018 Physicians Aren’t ‘Burning Out.’ They’re Suffering from Moral Injury. StatNews, July 26, 2018. Accessed [August 12, 2018]. https://www.statnews.com/2018/07/26/physicians-not-burning-out-they-are-suffering-moral-injury/
Wang, Tricia
2013 Big Data Needs Thick Data. Ethnography Matters, May 13, 2013. Accessed [September 9, 2018]. http://ethnographymatters.net/blog/2013/05/13/big-data-needs-thick-data/
West, Colin and Liselotte Dyrbye and Tait Shanafelt
2018 Physician Burnout: Contributors, Consequences, and Solutions (Review). Journal of Internal Medicine, 283(6), 516-529.