
With the Big Data hype, making digital data accessible and relatable for non-data experts is becoming an increasing challenge. In this paper we suggest Data Physicalization as a novel approach to facilitate conversations with collaborators about the meaning of data. While this challenge has been approached with data visualizations before, we propose that Data Physicalizations can bring stronger engagement and even more depth to the data than visualizations can offer. Based on four design examples, we investigate how data, when made physical, can be used to instigate valuable reflections between field researchers and non-data experts, and can serve as a platform for design. In all cases we worked with Data Physicalization to enhance our own understanding of the field, to engage collaborators in sense-making, and to move towards design proposals. In the concluding section we discuss the intricate process of developing such Data Physicalizations and suggest traits that make them successful.
INTRODUCTION
Our work with Data Physicalization draws on Design Anthropology, in particular as physicalizations seem to help with two challenges: to move beyond the knowledge that is accessible through observation and interview, and to engage our collaborators in making sense of their daily practices and exploring such potential changes that design may bring about.
Gunn, Otto and Smith (2013) argue that anthropology, although aiming for social change, is lacking the tools and practices to engage people in forming their own futures. Gunn and Donovan (2013) encourage anthropologists to adopt the design qualities of materiality (e.g. prototypes, collages, sketches) that can support people in articulating their experiences of the world and their practices. Kelly (2013) showed how the use of tangible interactions in processes of understanding and designing can help uncover deep insights. Design Anthropology aims to close the gap between observing and understanding, thus making ethnography part of an unfolding design practice (Gunn and Donovan 2013). Drawing on Tim Ingold’s work they argue that enabling people to make sense of their own experiences through materials, shifts perception of people from passive consumers to skilled practitioners during processes of enactment. Design Anthropology, while keeping a critical stance towards design, is occupied with making things tangible to enable people to make sense of technologies, systems and plans when engaging in everyday activities. Through interventional forms of fieldwork, involving tools such as videos, scenarios, mock-ups, props, prototypes and tangible interactions, knowledge is created through constant iterations of reflection and action (Gunn, Otto and Smith, 2013).
In our work, we have come to understand the power of Data Physicalizations as an entry point to learning how people reflect on their experiences. We invited people to make sense of their every day practices by interacting with their data in material form. These interactions challenged both researchers’ and participants’ understandings of the data. This paper inquires into Data Physicalization as a phenomenon, rather than taking a method focus. Through four examples of data physicalizations from library and welfare cases we investigate how and why they work to engage collaborators in ‘thinking with their hands’.
The short history of data physicalizations
Jansen et al. (2015) coined the term Data Physicalization to describe constructs designed to represent (big) data and help people explore, understand, and communicate data – as we humans explore the world around us with all of our senses. Data physicalizations may be static or interactive but have in common that they afford physical manipulation. They may convey (digital) data from systems or allow people to add or construct data about their own experiences. Physicalization is a way to invite individuals into reflective processes. Huron et al (2014) made a similar point with their ‘Constructive Visualizations’ that enable individuals to express themselves through adding or removing data tokens. Houben et al.’s (2016) proposal of a human-data design approach links data physicalization to learning: when individuals “create, share and use data through tangible and physical visualizations” they learn more about themselves and their environments. Knowledge is continuously constructed and deconstructed through the interactions we have with the world around us (Ackermann 1996; Kafai, 2006). This resonates with the way designers and architects work. They have over many years developed material practices, like model making and prototyping, to gain insights about how people experience the world. Hull and Willett (2017) suggest how data visualization take inspiration from architects.
Within data visualization, extensive research has been made on the aesthetics of “beautiful data” (Steele and Iliinsky 2010; Perer 2010; Wattenberg and Vie?gas 2010; Lima 2011), but McCosker & Wilken (2014) criticize that focusing on the end result of data visualization misses the opportunity of knowledge creation in the process. They argue that it is the creation of such diagrams, including all of the steps of planning, mapping, drawing and illustrating that generates understanding. This becomes relevant for Data Physicalization, as materiality affords manipulation and expression for active engagement.
Within ethnography, anderson et al. (2009) showed how data visualizations can be designed to involve participants in making sense of their own data, and thus diminish some of the authority that participants tend to give to the “objectivity” of the data. They claimed that this made participants more comfortable at providing explanations of the data, as they could see how some of the collected data could be misinterpreted. One quality to look out for in designing Data Physicalization is thus how they challenge the “objective” look of numbers and graphs.
In human-centred design research it has become popular to utilize materialization to ease the conversation between designers and ‘users’. For instance the generative tools of Sanders and Stappers (2014) (collages, Velcro prototyping) and the tangible business models (Mitchell and Buur 2010) both use design materials to surface memories and stories that otherwise can be tacit and difficult to put into words. In the same way Data Physicalizations can be understood as boundary objects (Star 1989) that enable people to work together and make sense of the data, even if they have different ways of understanding it. A Data Physicalization can become an object, which “sits in the middle of a group of actors with divergent viewpoints”.
Our research is exploratory, we investigate how Data Physicalizations support learning by allowing tangible manipulation, how they open up the process of analysis, how they challenge the ‘objectivity’ of data, and how they engage participants as boundary objects. In the following we analyze four experiments where participants co-created meaning with different Data Physicalizations.
TWO PROJECT CASES
Our data physicalizations were designed as part of two design projects, one situated in a library, the other relating to chronic pain.
Our first case was a collaborative project with the university library of University of Southern Denmark in Odense. Conditions for libraries have been drastically changing over the past 10 years, and university libraries increasingly find themselves providing groupwork spaces for students, rather than a repository of knowledge (McKay and Buchanan 2014). The library management encouraged us to use the data they collected through their various systems to better understand the practices of their users, and to point out where they might improve their services or the organization of the library. The project was initiated by an engineering department in our university that hoped to understand how human behaviors (and energy saving attitudes) relate to indoor climate. Our study was conducted in collaboration with 20 graduate design students. The data sets came from the gates, self-service machines, counter registrations, printer logs, Wi-Fi access points and environmental sensors, and they were recorded during two particular weeks in the Fall of 2017. After first creating visualizations of these data sets in various combinations, we made field observations in the library and interviewed library users and staff about the patterns we and they might see. As we realized that more was required to engage the librarians in meaningful conversations about their practices, we developed a set of data physicalizations to be used in design workshops with our collaborators, but also for a second round of field studies.
In our second case we studied chronic pain with arthritis patients based on self-tracking data from an App. Self-tracking has become a popular practice, in particular in the Quantified Self (QS) movement where individuals collect data about themselves and become both project designers, data collectors and critical sense-makers (Nafus and Sherman, 2014). Fiore-Silfvast & Neff (2013) report that within e-health, the discourse has shifted from what data means to how it can perform socially or organizationally – as catalysts for behavioral change. This is important for what role data physicalizations play in reflecting on behaviors. Sauvé et al. (2017) used physical artefacts as data representations with the argument that it makes data seamlessly available for the person trying to make sense of it – even if it does not capture the same amount of data as an App visualization. The chronic pain project was conducted by the third author of this paper. We worked with five patients with rheumatoid arthritis, who used a particular App, RheumaBuddy, to keep track of their pain levels day by day. The participants were asked to self-register their pain, fatigue, stiffness and mood on a scale from 1-10 over a period of six to nine weeks. They gave us permission to retrieve their data from the App developer. Through several iterations we developed data physicalizations to trigger conversations about their experience of pain. The company partner DAMAN develops digital healthcare solutions and collaborates with Danish Health Authorities to provide patients with tools to manage their diseases.
Analyzing the variety of data physicalizations designed in the two projects, we realize that they tend to fall into four categories in terms of how they scaffold conversations with our collaborators. In the following we will scrutinize archetypes for each of these categories.
1. TOUCHING DATA ENRICHES CONVERSATIONS
First, we focus our analysis on how physicalizations enable people to ‘touch the data’ and what kind of insights this triggers with our collaborators. The empirical base for our research is video documentation from one of the workshops, of how five groups in turn engaged with the data physicalizations to make sense of the practices in the library. The groups typically had 4-5 members: librarians, library researchers, design researchers and library users (students). We have transcribed the recordings and analyzed the video with a view to handling, gestures and verbalizations.
3D printed curves of noise and CO2
One of the library physicalizations consisted of 3D-printed shapes, where the jagged edges represented the levels of, respectively, noise on one and CO2 on another object, Figure 1. They were based on 4,031 data points from each of four environmental sensors (IC meters), which collected data on noise levels, temperatures and CO2-levels over the course of a week in different study areas. The data showed how temperatures stayed rather constant, while the noise and CO2 levels were quite high during day compared to during night. These parameters, which we received in Excel sheets, said very little at a first glance. However, filtering the data with respect to time of the day and the area from which it was collected, helped in creating an initial framing of how the data could become useful. We wanted to gain insights about how users are currently using the different spaces of the library, and how these insights could help inform potential re-design of the spaces to better support the activities of the users.
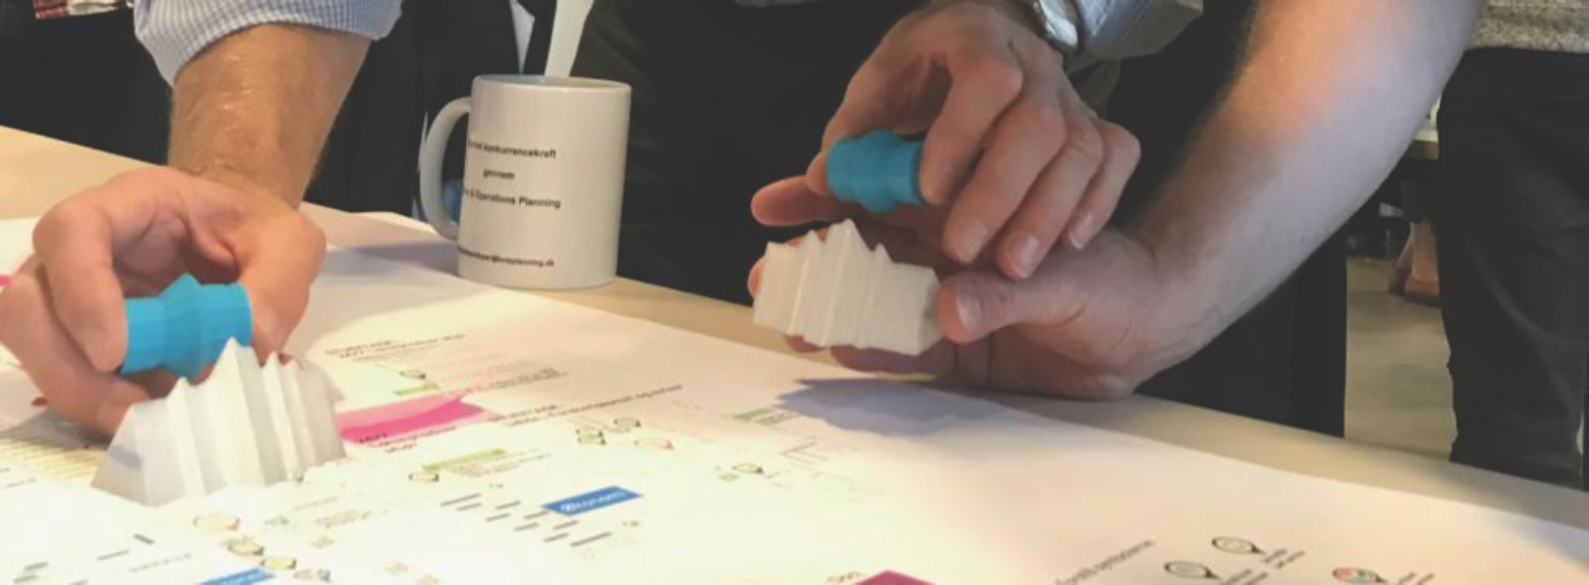
Figure 1. Workshop participants compare 3D printed curves of CO2 levels (blue) and noise levels (white) to find out from where on a library layout plan they might have been collected.
The 3D printed physicalizations imitated trivial data graphs, but being tangible, the data could be touched, moved around, rotated and handed over to others. The artefacts each represented data from one 24-hour day starting and ending at midnight. In the design workshop, the facilitators laid out a large blueprint of the library on the table, then invited each group of participants to discuss how they saw the noise and CO2 levels. This enabled the participants to reflect upon the data in terms of something tangible and relatable.
People make noise and CO2 – but not necessarily at the same time
We look at one illustrative situation: The facilitators hand one physicalization to each participant and ask them to guess where on the map they were recorded. This triggers intense discussions of what the curves mean, and whether they are different at all: “It’s the same” – “No, there’s two [spikes] here. There’s more noise here.” The participants begin noticing small details in the curves and in the urge to establish explanations, they start suggesting theories of their own about CO2 and noise:
- H The CO2 level will depend on how many people there are, and how much ventilation there is.
- S I would prefer to move this one (moves blue CO2 physicalization) to a smaller room, because you have a big increase in CO2 over a short time. I think that room is too big.
- MK So, from the CO2 point; (turns both blue curves in hand) when humans produce CO2 you’ll have this kind of spike, whereas this looks more like a place where people are sitting close by and the CO2 comes more times.
- (H is a design researcher, S a library user, MK is a software engineer)
In one of the groups there is a breakthrough, when participants realize that noise and CO2 levels do not necessarily follow each other, as one might think: More people means more noise and more breathing and hence more CO2:
- B OK, the most noisy one in the entrance area. Or what? (places a white noise curve on the layout plan near to the main library entrance)
- K (puts a CO2 curve next to it)
- H So from the entrance area and upstairs. Of course there’ll be noise here. But they won’t stay for long, so the CO2 is not there.
- (B is a library researcher, K is a library user, H is a design researcher)
The library entrance area may be very noisy, but has a low CO2 level, as people only move through. On the other hand, the silent reading space is often quite full, but completely silent, so the CO2 level would be high, while noise is low. To an indoor climate engineer such explanations of how human behavior can be read in environmental data will sound banal, but to the participants they help better understand where and when they may hear complaints from library visitors.
Touching data shifts ownership
The physicalizations enabled the participants to move the data around the map, without any permanent changes being made to the data. Assumptions about the spaces and how they were used surfaced as the participants needed to agree upon which area on the map the data might represent, and why. Doing this, the data physicalizations worked as tools for collaborative sense-making of what the data meant in the context of the library space.
With these data physicalizations, comparisons played a central role in making sense of the data. We saw participants constantly matching two against each other, to understand the finer details that make them different. We also observed that often the physicalization got used as a ‘talking stick’ – participants raised the artifact to be heard in the conversation.
2. JUXTAPOSING DATA SHIFTS PERSPECTIVES
As we saw in the first physicalization example, the act of comparing data is crucial to sense-making. This is well-known from data visualization: it is the difference between curves rather than the curves themselves that help disclose insight. The juxtaposition of data sets suggests new perspectives. This is even more pronounced in the following example.
Laser-cut graphs of chronic pain
For each chronic patient we received 160-250 data points. The data was laser cut in acrylic material in the shape of graphs of different colors, representing pain, fatigue, stiffness and mood, Figure 2. The idea was to enable participants to freely combine and compare the user-generated data from the mobile App.
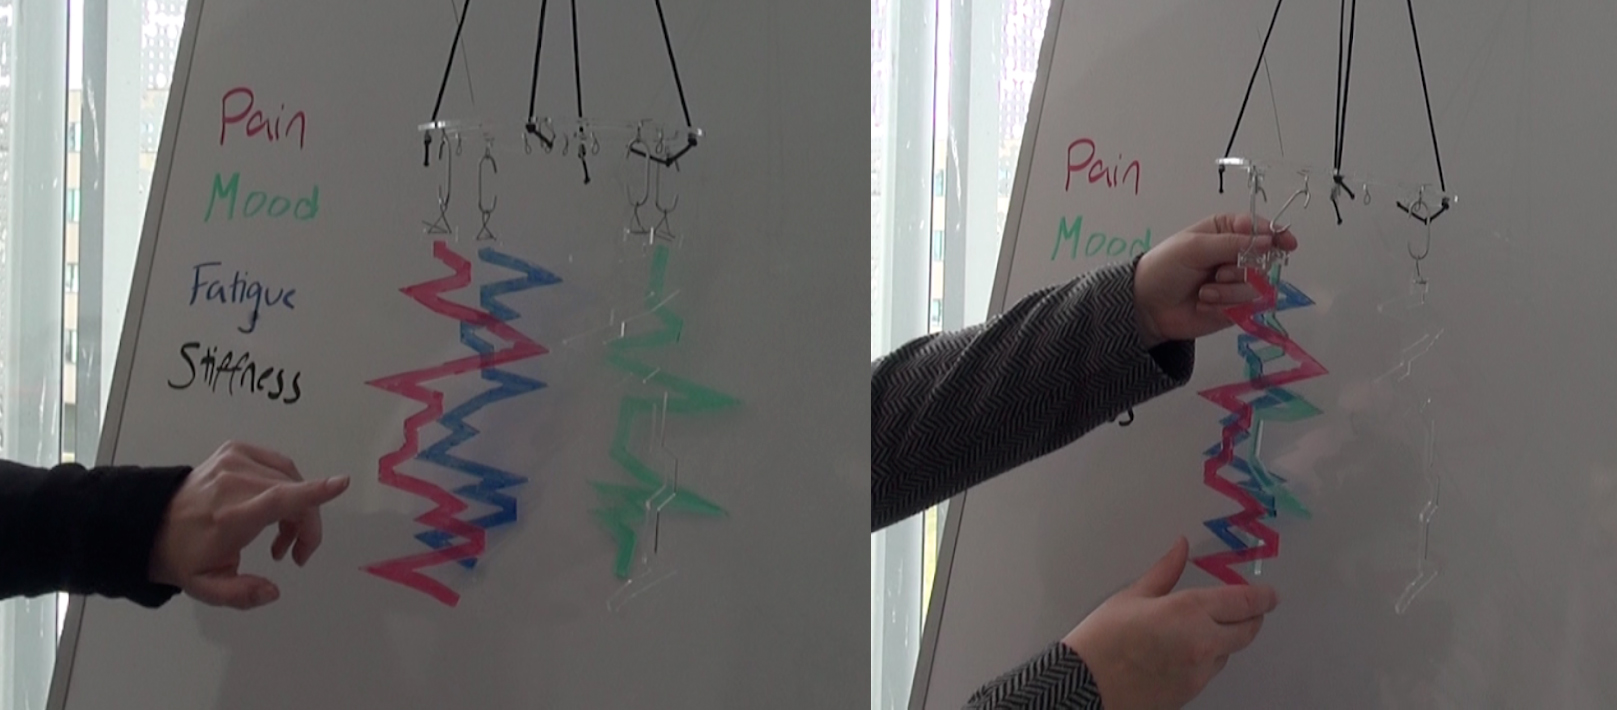
Figure 2. Self-tracking data of chronic pain patients physicalized as acrylic graphs in different colors. To the left the interview participant points out what parts she relates to her story. To the right the researcher places the acrylic graphs on top of each other as encouraged by the participant.
The graphs were hanging from strings and used in interviews with the chronic pain patients: “This is your data from the RheumaBuddy app, where you have been tracking your pain, fatigue, stiffness and mood. I have changed your raw data into these physical graphs, in order for us to see what we can uncover from the data”.
Multifaceted pain – and a chronic pain ‘filter’
The first participant, suffering from posttraumatic chronic pain, is intrigued to see the graphs on top of each other, so she can get an overview of how the different data relate to each other:
- A It is nice to see that there is a connection between it [the parameters of pain, fatigue etc.] and that sometimes my mood is affected by my pains. And the other way it is nice to see that my mood can be affected just because it is raining, just like everyone else.
- Why do you think there are peaks in the graph?
- A It can be if I have been with many people, or there are many people around me, for instance during a trip to the mall. That can be very tiring. (…) The pain of course comes from me walking around, but that pain would also come if I was just taking a walk. These two (points at the blue [mood] and green [fatigue] graphs) are because it can be quite stressing to walk around having to constantly be aware that no one bumps into you [at the mall].
- Do you think having fatigue affects your pain?
- A Yes, because I can’t keep up the same filter. I can’t ignore the pain. So I don’t know whether that could be why I feel more pain when I am tired.
The interaction with the graphs help us – along with the patient – understand more of the complexities of chronic pain, that the pain experience is highly situated. What is interesting in this dialogue is how juxtaposing the acrylic graphs encourages reflection on how pain depends on many other aspects. The concept of a ‘filter’ helps us understand better the effort it takes to live with pain, and how socializing and fatigue may influence the experience of pain.
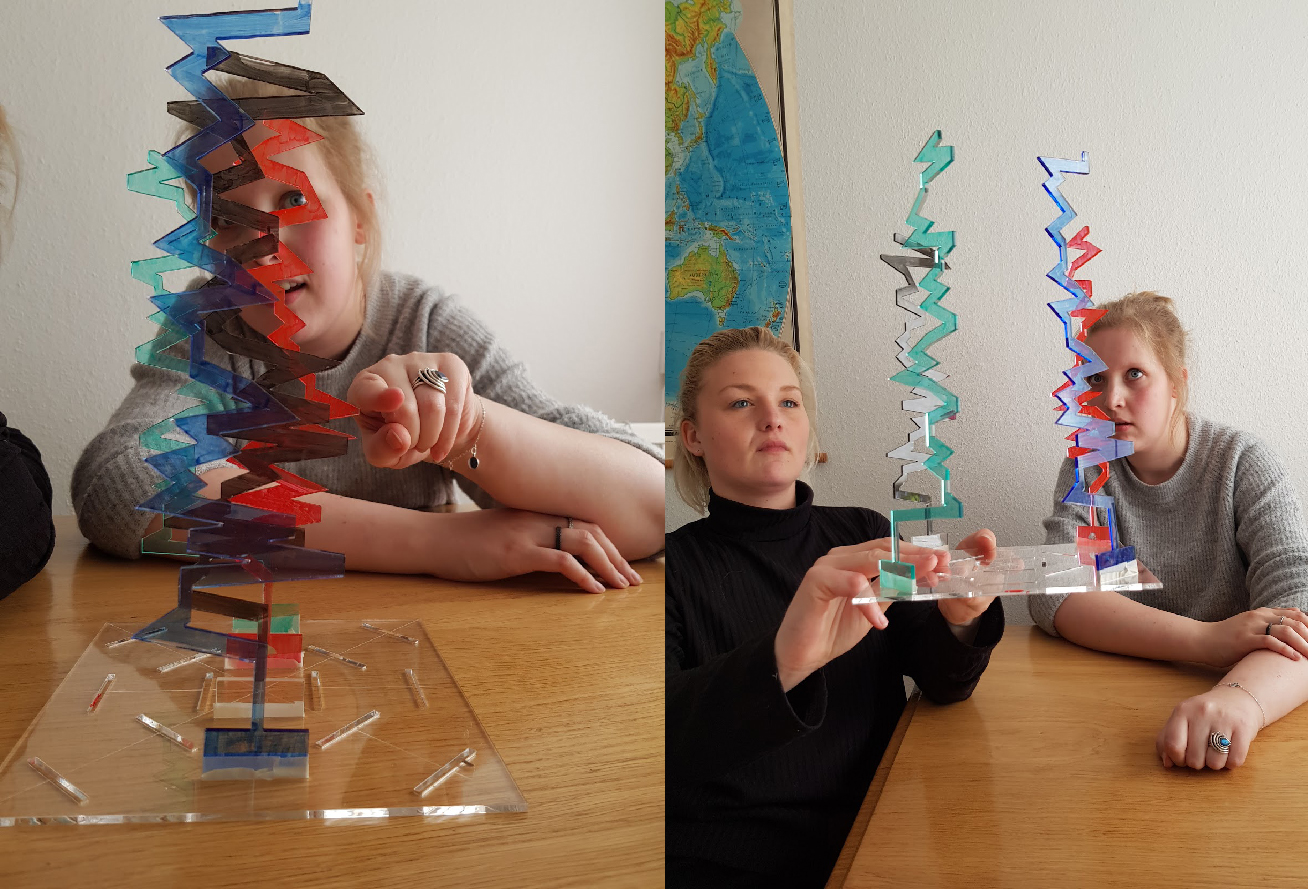
Figure 3. To the left the participant gestures through the physicalization how the four graphs can be seen to relate. To the right her friend turns the base plate to examine different combinations of curves.
For an interview with another patient the researcher slotted the acrylic graphs into a plate, so the construct could be picked up, rotated and seen from diverse angles. The chronic pain patient in this interview is accompanied by her friend, who herself suffers from fibromyalgia. The patient explains how she thought there was a certain hierarchy to the parameters, but that after arranging the graphs in one line she can see that there could be certain reciprocal connections between the data, Figure 3.
- F Wasn’t this when you were sick?
- B I can’t really remember, but I know that I worked a lot in that period, and had a lot of building work. My dad came with new floors. So it was a little stressful to have to prepare for that. So I know this (pointing at the peak) is a result of something. I actually think this was exactly the building period. Or wait, this must have been before, because my mood seemed to be good then. So it must have been while I was working a lot.
The participant first tries to explain the peak in pain level with the stress of having to renovate the floor, but then changes her mind as she sees it in relation to her mood. She then says that it must have been work related, as her mood was good in that period. Obviously the patient experiences pain, but the juxtaposing shows that the pain expression cannot stand alone. The experience of pain is much more than suffering; it affects other parts of the patient’s life.
Juxtaposition of curves invites new perspectives
Like we saw in the previous case, the comparing of data sets is instrumental in bringing about theories of what human practices lie behind the data. By turning the square base plate, the participant could choose to compare any two of the graphs – “so now I can look at them like this”. “This way you can see these two together”. Each combination provided a new perspective on the data. At one point the friend also picked up the physicalization and rotated it, Figure 3 (right):
- F But it doesn’t really make sense. This [fatigue] peaks out way more right here compared to this one [stiffness]. So you are much more tired than you are stiff? (she rotates it again) This is actually a little fun. You are actually a very happy person. Well I knew that, but it makes me all happy inside to see it.
The participants explored several angles and relationships, reflecting deeper on how the graphs related to each other. The physicalization turned into a boundary object (Star 1989), inviting collaborators to engage and communicate something that is usually difficult to express. The friend was able to relate to the participant’s experience of chronic illness and could help her contextualize the data and bring forward stories and explanations.
3. STACKING DATA HELPS IMAGINE “WHAT COULD BE”
While our first two examples of data physicalizations investigated how people are able to touch data and juxtapose different views of data, in both cases data as such was constant, presented as recorded. In our third example, we explored how participants are able to reconfigure (or de-construct) data in an attempt to both make sense of what is and to discuss what could be. It also drew on the library project but was based on another data set. The library has 4 service counters with very different ‘loads’ of queries from the library users. In an attempt to analyze what occupies the librarians at each counter, management installed a self-registration procedure for tracking query types. For the past year, the librarians on duty had been asked to register every query they responded to at each of the four desks by ticking a box on an iPad. The screen had 13 pre-defined categories, for instance:
- Question about a book title
- Find way to a shelf
- Referral to a colleague
- Help with pickup of reserved material
- Help with book return
Curiously, ‘Find way to the toilet’ had its own category, perhaps because the signage in the building was not so very clear. The list led us to ponder about library practices and library design: What activites are important for librarians to manage? Should some of these seemingly mundane tasks rather be shifted to library users to free up time for more ‘valuable’ work? How is the library lacking in terms of enabling visitors to use the library independently?
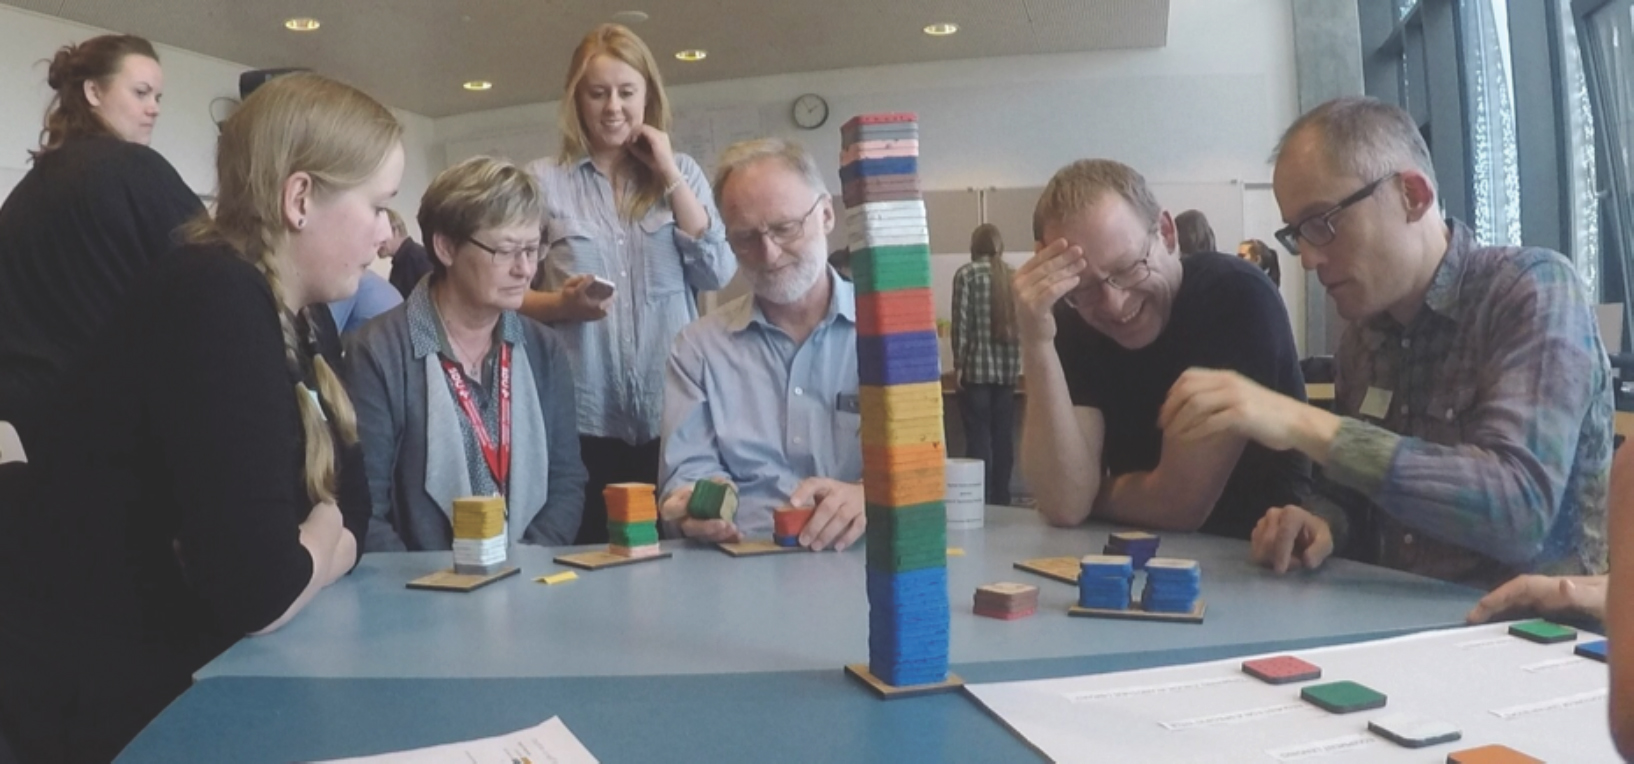
Figure 4. The physical bar graph in a librarian design workshop. A physicalization of the 670 queries the librarians respond to at the main service desk during a week, split into 13 color coded categories.
Physical bar graphs of customer queries
We received 1,151 data points spread over four desks during a full week. We chose to focus the physicalization on the main counter with 670 queries during that week. They were represented in the form of a physical bar graph, which proved very successful in the design workshop, Figure 4. The bar graph was a stack of 67 wooden tokens that each represented 10 queries of the same category. Each category had its own color coding. Thus, the physicalization showed the total number of counter queries in a week divided into categories by color. Further, for each participant in the workshop, there was a board with two squares to place tokens on: One said ‘Librarian’, the other ‘Student’. The idea was that for each of the query categories, one could split the stack of tokens into two towers. One for how many of those specific queries ‘ought to be’ the responsibility of the students, the other for the librarians to handle. This allowed participants to rearrange the data and add new meaning, while maintaining the “numbers”.
Like in the 3D curve case, the data physicalization was deployed with five groups of participants in a design workshop. The librarians, library researchers and potential users of the library (students) each received 2-3 categories of tokens and a board and was asked to negotiate with a co-participant how the data tokens should be divided between “responsibility of the student” and “responsibility of the librarian”.
I guess they haven’t tried
To indicate how participants created new meaning with the data tokens, here follows an example of how two participants (a librarian G and a design researcher H) negotiate how to split a stack of 8 dark green tokens ‘Help finding a specific book title’, Figure 5. Should this be the librarian’s or the students’ responsibility? Is this part of librarians’ work?
- G I would like something there (points to the ‘student’ field on board)
I guess they haven’t tried, or perhaps they have trouble. (…) - H But you would like them to try?
- G I would like them to try, yes. Some time we should put them [all]there (points to ‘students’)
- H (shifts 2 tokens out of 8 to ‘students’). Figure 5(left).
- G Perhaps one more! (shifts one more) (laughter). Figure 5(mid).
- H So it’s kind of loose this way. Ideally you would want all of them here (lifts the rest of the stack towards ‘students’ and back to ‘librarians’). Figure 5(right).
- H In an ideal world, would that be the ratio you’d like, or would you like more like this? (7 tokens on students, one on librarians)
- G Yes!
- H But in the real it is less (indicates 2 on ‘students’, 6 on ‘librarians’).
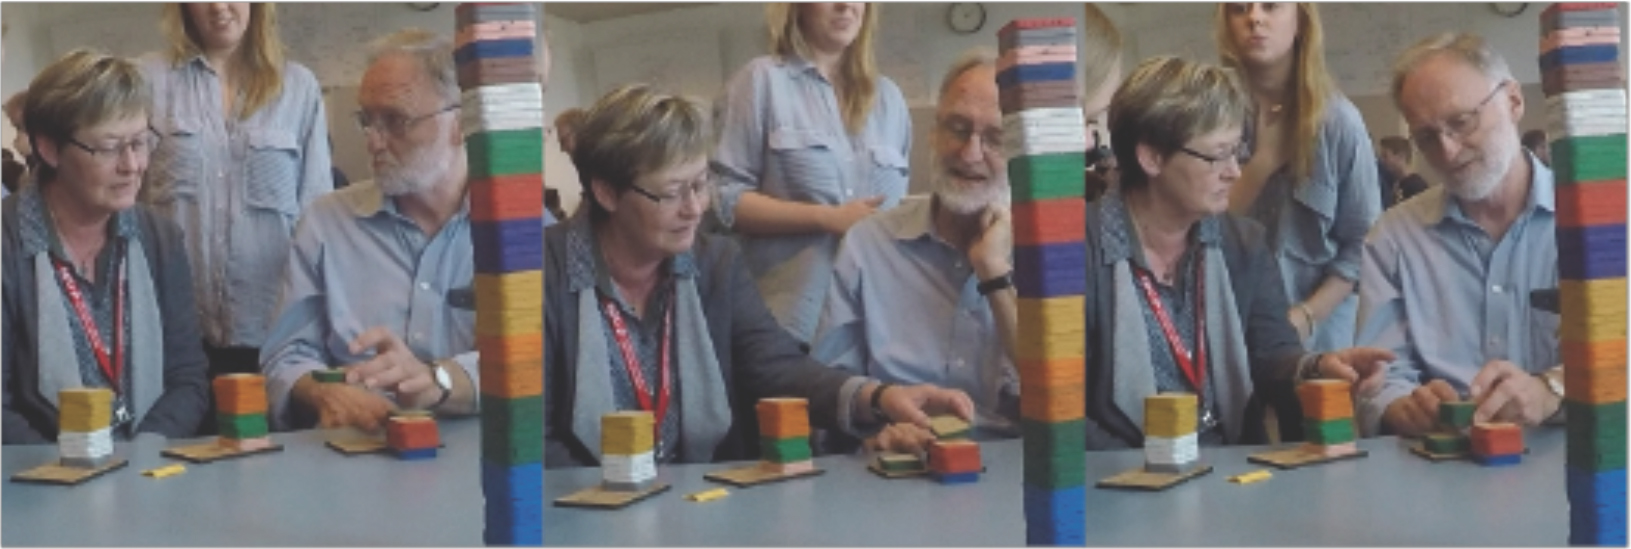
Figure 5. A librarian and a design researcher negotiate how many tokens (‘Help finding a specific book title’) should go on the ‘student’ side of the board, and how many stays on the ‘librarian’ side.
The librarian suggests that some of the current queries could be shifted to the students, if this is simply about asking how to find a specific book title. At least if they ‘haven’t tried’ themselves. They gradually increase the stack of ‘student responsibility’ until H suggests that they should be looking towards an ‘ideal world’, where the librarian would ‘want all of them here’. But realistically, they agree, only a small part (1 token = 10) of those 80 queries a week can be shifted. An interesting ethnographic finding of this part of the study was that – challenged by the task to split queries between ‘Librarian’s Work’ and ‘Student Self-Service’ – the librarians formed an agreement about the importance of user contact for their work; that even a book return at the counter, or a trivial question about where to find the toilet, may lead to valuable conversations about books!
De-constructing data sets encourages experiments
The toying with data tokens facilitated dynamic discussions about what the data tell about current practices, and it encouraged the participants to speculate about how things might be different in the future. Different stack configuration experiments could suggest different meanings. Interestingly, the physical bar graph became a tool for the less knowledgeable workshop participant to interview the experienced participant about the current and potential future practice: Do you do this? Would you like that? This pattern was confirmed in other groups too. But then, analyzing the videos, we realize that this is as much a product of the workshop facilitation: When the token stack was ‘owned’ by ones less knowledgeable about practices, they would use the tokens as an interview tool. If the stack was placed in front of a librarian, they would take initiative, and their co-participant rather confirm the arguments and actions without touching the tokens.
4. CO-CONSTRUCTING DATA PROVIDES DEPTH
Our last example takes the physical manipulation of data even further, to the co-construction of data with collaborators in the field. The data came from the same library case: how heavy is the wi-fi use in different parts of the library, and what might that tell us about visitor use of the library layout? We started out with 23,000 data points collected from 45 access points during a single 24-hour period. Armed with a map of the transmitter locations, we first filtered the data to find the areas with the highest numbers of wi-fi connections, assuming that those must also be the areas with most people. Further, the data was filtered with respect to time, narrowing down to the period from 12 to 5 pm. Our aim was to understand why these areas were most commonly used, and to investigate if the spaces were appropriately designed.
Tracing wi-fi use diagrams in the library
For our field studies in the library we printed graphs of the wi-fi data, but we additionally prepared physical boards with yarn, pins and sticky notes to invite participants to construct their own data physicalization of how they perceived their wi-fi use throughout a day, Figure 6. With the pins, one would be able to create a ‘graph’ of highs and lows against the hour axis, and the sticky notes would help explain.
In the field, we started out observing those areas, which we assumed were used by most students in the selected time span. We quickly learned that our initial assumption was wrong: there simply were not as many students as the data would have us believe. Explanations were found in extra self-service machines connected to wi-fi and a full cafeteria downstairs. Realizing that the students were elsewhere, we searched for the popular areas and found interviewees: a female student, two young male students and a group of three young students (one male, two females). With a starting point in the data visualizations, we invited them to discuss how they were using wi-fi in the library, and then challenged them to show us in a yarn diagram.
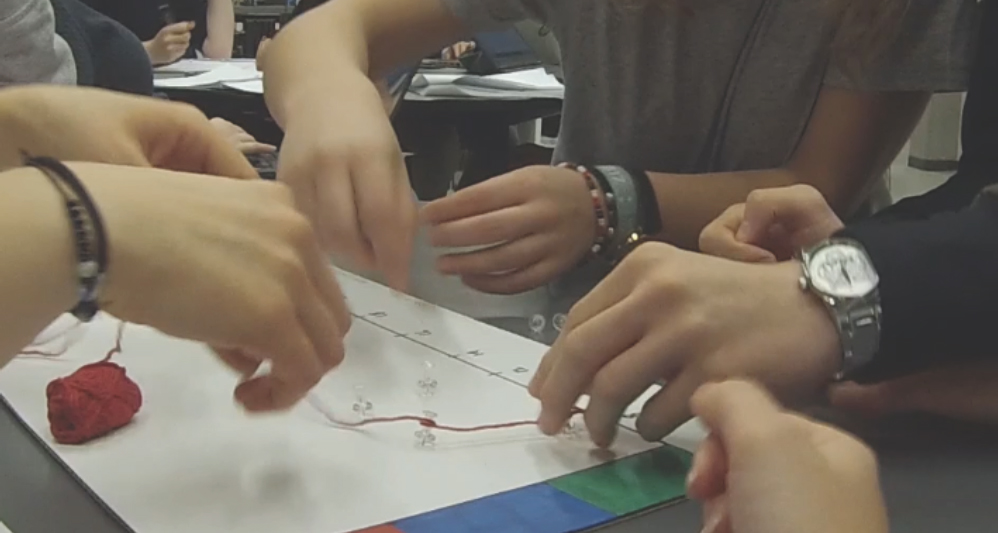
Figure 6. A group of interviewees co-create a diagram with yarn and pins of how they perceive their use of wi-fi through a full day at the library.
Importance of wi-fi – or concentration
As the timeline of the board runs for a full 24 hours, the interviewees start their graph in the morning, before going to university. The female student explains how “I hear music when I get ready, so I probably use a little bit”, while she pulls the yarn up slightly on the board. The two males conversely put their yarn all the way up on the wi-fi scale in the morning:
- S2 Checking [on Facebook] that everything is okay in the world (…) because I have nothing else to do. When the alarm goes off I am not one to jump out of the bed. I will be lying there anyways, and if I have no internet I will be pissed off probably.
When asked about the period in the library, the female interviewee stretches out the yarn to a straight line fairly low on wi-fi use explaining “here I am studying”. In the same period, the two males bring the yarn up completely to the top stating, “because here we have to be productive, which requires us to be really focused”. And the three students discuss how “after this period we are probably tired”, while making a straight line with the yarn followed by a sudden low. Towards the evening time, the female student puts the string up high to the red area stating:
- S1 Well it is because I think I watch too much Netflix. And I use the wi-fi much more here. Over here (pointing to the day time) it is much more constructive work, where it is like I have to use the internet, while here (evening time) I could be doing something else.
The two males put the string very low by the end of the day with the explanation “I will be sitting alone at dinner, maybe scrolling through my phone”.
What is important to notice is how wi-fi and the use of the internet is conceptualized very differently from what is measured. While the data on wi-fi was derived from the system based on the number of connected devices at any time, the data physicalizations constructed by the interviewees showed an entirely different story. The two males made a high wi-fi peak in the morning explaining the importance of having wi-fi. They also put the wi-fi high when they had to work, because it required them to be focused, while the female put it rather low with the explanations that she would not be using wi-fi as she had to be concentrated. She consequently put a high peak in the evening, because it represented the guilt associated with using wi-fi to watch too much Netflix, while the other participants put it low with the argument that using wi-fi in the evening is not that stressful. Observations confirmed that group work in the library would commonly mean less use of wi-fi, adverse to our assumption of ‘more wi-fi, more activity’.
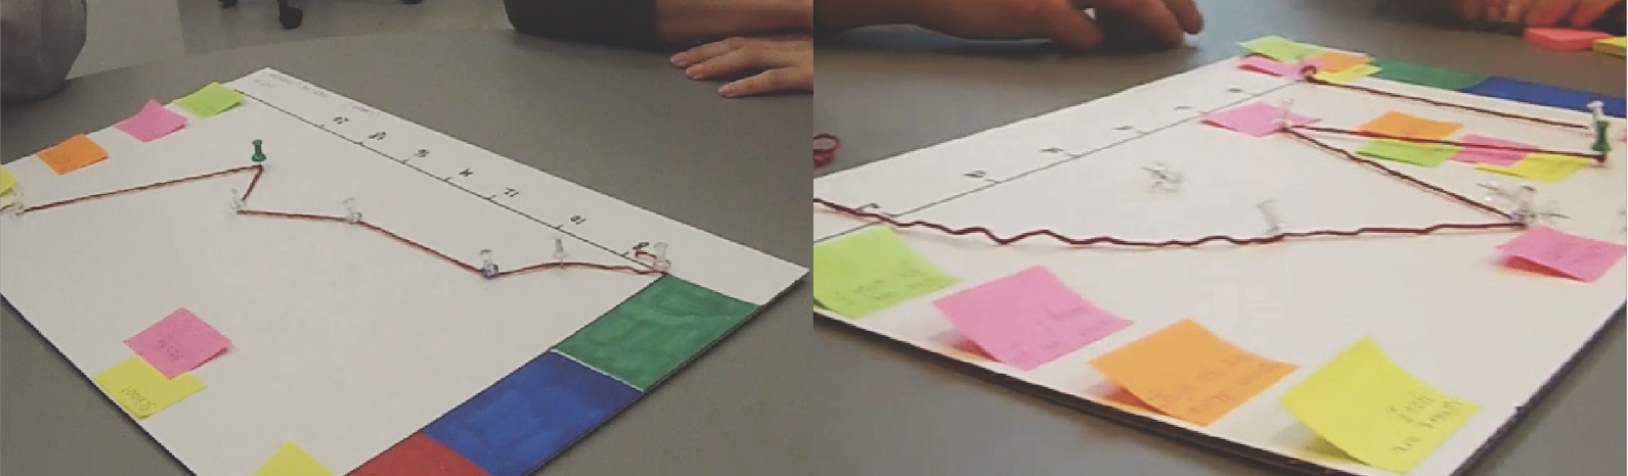
Figure 7. One physicalization shows a high peak in wi-fi use by the end of the day to represent the “guilt” associated with Netflix consumption, while the other explains the low by the end of the day with how not stressful it is.
Co-constructing curves provides depth
Data physicalization became a tool for discussing something the interviewees did not put much thought to. It was not exact to a particular scale but provided a depth of insight, which cannot be derived from the system data. The simple materials (yarn, pins) allowed the participants to change their mind and the placement of the yarn while reflecting. This would not have been possible, had we asked them to draw the graph on paper. Inviting participants to co-construct their own data physicalizations, helped us bring new meaning to the Big Data in our possession.
DISCUSSION
Based on our experiments, we reflect on the design of data physicalizations and how they can add depth and engagement to the understandings of data. In the library case, the data physicalizations quite clearly seemed to empower the librarians to verbalize their practices and values, and to think along in how practices might change. We learned, for instance, that concentration is still a core quality of being at the library, it just cannot be adequately expressed in noise measurements or wi-fi use figures. Habits play a strong role in how users approach librarians – but core to the librarians’ work is really the personal contact, which can come about in many ways. With our engineering colleagues, the sessions helped challenge the assumption that the data from the ‘system’ can easily be used as basis to understand human behaviors and even suggest improvements to the interior and services.
Similarly, in the chronic pain case, the physicalizations to the relief of the patients provided a richer means of expressing their experiences than just talk, or pain scales. With the patients we learned that the experience of pain is highly situated and multifaceted; that the momentary pain experience will be filtered or masked through for instance moods and fatigue. The outcomes of the data physicalization sessions – along with those of a cultural probes study and autoethnography – helped us design artefacts for our collaborators to use themselves to convey how they feel to relatives and doctors.
How does data physicalization work?
Our experiments show that it is indeed possible to bring data like the sets used here on a physical form where it can successfully support conversations about human practices and experiences. But what have we learned about how the physicalizations work more precisely?
Touching Data – touch seems to convey responsibility and ownership: Participants feel compelled to do something with the data, explain what they might mean, where they belong. Also, the physicalizations can work as ‘talking sticks’, bestow the right to talking turns.
Juxtaposing Data – the easy comparison of different sets of data against each other provides new perspectives. It asks questions about human practices that need answering. Comparison is not just a question of visible differences, it may as well engage touch or other senses.
Stacking Data – the de-construction of data sets is a powerful encouragement to perform small experiments and discuss how practices might be different in the future. We have seen how this de-constructing may serve as interview prompts between the participants.
Co-constructing Data – when challenged to express their experiences in numbers and curves, participants reflect about their practices. This provides a depth of insight seldom achievable through interview and observation.
How ‘big’ data can be physicalized?
Physical representation brings along restrictions when they are based on large data sets (Big Data), as they naturally cannot capture the entire data sets. Did we indeed relate to Big Data, and is physicalization of Big Data at all possible? In the traditional definition of Big Data as ‘data sets that are so big and complex that traditional data-processing application software are inadequate to deal with them’ (Wikipedia), even our 23,000-point set hardly qualifies as Big Data. On a human scale, however, they are well above what we can deal with. “Big” may be understood differently in our four examples, stressing how the applications of data physicalizations differ. In most of the examples we had to reduce raw data points available to be able to physicalize the data. We will argue with Noraisas & Karpfenm (2014) and Nafus (2016) that the reduction of data must in itself be seen as a process of creating comprehensible meanings. The process of reducing data poses relevant questions for deciding which data to omit and, as we saw in the cases, sometimes the questions lead to assumptions that prove wrong. While physicalizations may require reduction of data, their real strength lie in how they encourage manipulation, expression and questioning, and elicit rich stories and co-constructed theories – something Big Data or data visualization can fail to do.
Is Data Physicalization promising method?
None of the participants prior to the workshops had been exposed to data physicalizations. Therefore, we used shapes familiar to them: curves, bar graphs, making it more relatable for the participants. As data physicalization develops, we expect more vivid designs and technologies to support those designs. To spread this approach as a general method, we need many more examples and design principles to help transform data into meaningful physical designs. This is a worthwhile challenge for (Tangible) Interaction Design research.
Data physicalization has a potential of contributing to the expanding practices of turning field observations into ‘material’ that can serve as basis for participatory sensemaking (Buur & Sitorus 2007), as has been underway with Cultural Probes (Gaver et al 1999; Mattelmäki 2006), video material (Buur et.al 2000; Raijmakers et.al 2009) and Provotypes (‘provocative prototypes’, Boer et.al 2013). In their simplest form we might understand data physicalizations as interview prompts, to be used to challenge informants to tell us about their practices and experiences. However, along with the recent developments in Design Anthropology, we rather like to see them as tools in interventional fieldwork to engage collaborators in making sense of their own practices and forming their own futures.
Jacob Buur is a professor of user centered design researching the role of design materials and video in participatory innovation and interventional fieldwork. buur@sdu.dk
Sara Said Mosleh is an interaction designer completing her graduate studies in IT Product Design. sasmo@sdu.dk
Christina Fyhn Nielsen is a multimedia designer and research assistant in computational thinking. cfni@sdu.dk
ACKNOWLEDGEMENTS
We would like to thank the IT Product Design students at University of Southern Denmark for their creative ideas for data physicalizations in the library case, and Mary Karyda, Aalto University, for inspiring them. Also, thanks are due to librarians, library users and chronic pain patients, who accepted to collaborate with us.
REFERENCES
Ackermann, Edith
2004 Constructing Knowledge and Transforming the World. A Learning Zone of One’s Own: Sharing Representation and Flow in Collaborative Learning Environments Part 1: 15–37.
Aipperspach, Ryan; Rattenbury, Tye Lawrence, Woodruff, Allison; Anderson, Ken; Canny John. F; Aoki, Paul
2006 Ethno-Mining: Integrating Numbers and Words from the Ground Up. (EECS-2006-125.pdf).
Anderson, Ken; Dawn Nafus; Rattenbury, Tye, and Aipperspach, Ryan
2009 Numbers Have Qualities Too: Experiences with Ethno-Mining. In EPIC 2009 Proceedings Pp. 123–140.
Boer, Laurens; Donovan, Jared, and Buur, Jacob
2013 Challenging industry conceptions with provotypes. CoDesign 9(2), Taylor and Francis: 73-89.
Buur, Jacob; Binder, Thomas and Brandt, Eva
2000 Taking Video beyond ‘Hard Data’ in User centered Design. In Proceedings of Participatory Design Conference, New York, NY, 21-29.
Buur, Jacob, and Larisa Sitorus
2007 Ethnography as Design Provocation. In Ethnographic Praxis in Industry Conference Proceedings Pp.
Curran, John
2013 Big Data or ‘Big Ethnographic Data’? Positioning Big Data within the Ethnographic Space. Ethnographic Praxis in Industry Conference Proceedings 2013(1): 62–73.
Fiore-Silfvast, Brittany, and Gina Neff
2013 What We Talk about When We Talk Data: Valences and the Social Performance of Multiple Metrics in Digital Health. Ethnographic Praxis in Industry Conference Proceedings 2013(1): 74–87.
Gaver, Bill, Tony Dunne, and Elena Pacenti
1999 Design: Cultural Probes. Interactions: 21–29.
Gunn, Wendy, and Jared Donovan
2012 Design and Anthropology. Wendy Gunn and Jared Donovan, eds. Pp. 1-16. Surrey: Ashgate.
Gunn, Wendy, Ton Otto, and Rachel Charlotte Smith
2013 Design Anthropology. Wendy Gunn, Ton Otto, and Rachel Charlotte Smith, eds. Pp. 1-29. Madison: Bloomsbury Publishing Plc
Gwilt, Ian, and Nick Dulake
2017 Understanding the Needs and Desires of Service Users in the Design and Creation of Meaningful Physical Data Developed by the Authors and Is Presented in The. In The ACM SIGCHI Conference on Designing Interactive Systems. Brian O’Keefe and Augusto Esteves, eds. Edinburgh: ACM. Sheffield Hallam University.
Haines, Julia Katherine
2017 Towards Multi-Dimensional Ethnography. Ethnographic Praxis in Industry Conference Proceedings.
Houben, Steven, Connie Golsteijn, Sarah Gallacher, et al.
2016 Physikit: Data Engagement Through Physical Ambient Visualizations in the Home. In Proceedings of the 2016 CHI Conference on Human Factors in Computing Systems (CHI ’16) Pp. 1608–1619.
Hull, Carmen, and Wesley Willett
2017 Building with Data: Architectural Models As Inspiration for Data Physicalization. In Proceedings of the 2017 CHI Conference on Human Factors in Computing Systems Pp. 1217–1264.
Huron, Samuel, Sheelagh Carpendale, Alice Thudt, Anthony Tang, and Michael Mauerer
2014 Constructive Visualization. In Proceedings of the 2014 Conference on Designing Interactive Systems – DIS ’14 Pp. 433–442.
Jansen, Yvonne, Pierre Dragicevic, Petra Isenberg, et al.
2015 Opportunities and Challenges for Data Physicalization. In Proceedings of the 33rd Annual ACM Conference on Human Factors in Computing Systems – CHI ’15 Pp. 3227–3236.
Kafai, Yasmin B.
2006 Chapter 3: Constructionism. In S The Cambridge Handbook of the Learning Sciences, awyer, R. Keith (Ed.) Pp. 35-46. Cambridge University Press
Mattelmäki, Tuuli
2005 Applying probes – from inspirational notes to collaborative insights. CoDesign 1(2). Taylor and Francis: 83‐102.
Lanclos, Donna, and Andrew D Asher
2016 “Ethnographish”: The State of the Ethnography in Libraries. Weave: Journal of Library User Experience 1(5): n.p.
McCosker, Anthony, and Rowan Wilken
2014 Rethinking “big Data” as Visual Knowledge: The Sublime and the Diagrammatic in Data Visualisation. Visual Studies 29(2). Taylor & Francis: 155–164.
McKay, Dana, and George Buchanan
2014 On the Other Side from You: How Library Design Facilitates and Hinders Group Work. In OzCHI ’14 Proceedings of the 26th Australian Computer-Human Interaction Conference on Designing Futures: The Future of Design Pp. 97–106.
Mitchell, Robb, and Jacob Buur
2010 Tangible Business Model Sketches to Support Participatory Innovation. In Proceedings of the 1st DESIRE Network Conference on Creativity and Innovation in Design Pp. 29–33.
Nafus, Dawn
2014 This One Does Not Go Up to 11 : The Quantified Self Movement as an Alternative Big Data Practice 8: 1784–1794.
Nafus, Dawn
2016 The Domestication of Data: Why Embracing Digital Data Means Embracing Bigger Questions. Ethnographic Praxis in Industry Conference Proceedings (2014): 384–399.
Norvaisas, Julie Marie, and Karpfen, Jonathan “Yoni”
2014 Little Data, Big Data and Design at LinkedIn. Ethnographic Praxis in Industry Conference Proceedings 2014(1): 227–236.
Raijmakers, Bas; Sommerwerk, Andreas; Leihener, Julia and Tulusan, Indri
2009 How sticky research drives service design. Proceedings of Sercice Design Network conference, Madeira
Sanders, Elizabeth B N, and Pieter Jan Stappers
2014 Probes, Toolkits and Prototypes: Three Approaches to Making in Codesigning. CoDesign 10(1). Taylor & Francis: 5–14.
Sauve’, Kim, Steven Houben, Nicolai Marquardt, et al.
2017 LOOP: A Physical Artifact to Facilitate Seamless Interaction with Personal Data in Everyday Life. In Proceedings of the 2016 ACM Conference Companion Publication on Designing Interactive Systems – DIS ’17 Companion Pp. 285–288.
Star, Susan Leigh
1989 Chapter 2 – The Structure of Ill-Structured Solutions: Boundary Objects and Heterogeneous Distributed Problem Solving. In Distributed Artificial Intelligence. Les Gasser and Michael N. Huhns, eds. Pp. 37–54. Elsevier Inc.
Steele, Julie, and Iliinsky, Noah
2010 Beautiful visualization: looking at data through the eyes of experts. O’Reilly Media, Inc.
Wattenberg, Martin, and Viégas, Fernanda
2010 Beautiful Visualization: Looking at Data Through the Eyes of Experts. In Beautiful history: Visualizing wikipedia. Pp. 175-91. O’Reilly Media.