
A key challenge in carrying out product design research is obtaining rich contextual information about use in the wild. We present a method that algorithmically mediates between participants, researchers, and objects in order to enable real-time collaborative sensemaking. It facilitates contextual inquiry, revealing behaviours and motivations that frame product use in the wild. In particular, we are interested in developing a practice of use driven design, where products become research tools that generate design insights grounded in user experiences. The value of this method was explored through the deployment of a collection of Bluetooth speakers that capture and stream live data to remote but co-present researchers about their movement and operation. Researchers monitored a visualisation of the real-time data to build up a picture of how the speakers were being used, responding to moments of activity within the data, initiating text conversations and prompting participants to capture photos and video. Based on the findings of this explorative study, we discuss the value of this method, how it compares to contemporary research practices, and the potential of machine learning to scale it up for use within industrial contexts. As greater agency is given to both objects and algorithms, we explore ways to empower ethnographers and participants to actively collaborate within remote real-time research.
INTRODUCTION
It is challenging to gain an understanding of the complex relationships between people and things due to the rich and messy intricacies of everyday life. The development of remote in the wild research methods across fields such as ethnography and human computer interaction (HCI) can help unravel some of these complexities in a contextually grounded manner (Anderson et al 2009; Crabtree et al. 2013). Research methods, such as design ethnography allow us to identify how design can help address people’s needs (Salvador, Bell, and Anderson 1999). While the knowledge we gather from ethnographic research is rich, contextually grounded, and benefits from minimal disruption to the lives of participants, it is currently difficult and costly to implement at a large scale. Contemporary design ethnography practices, such as thing ethnography, ethno-mining, and Ethnobot, offer promising new directions for remote ethnographic research, with potential to be scaled up. Meanwhile HCI research methods such as experience sampling and diary studies, can be implemented at scale, but often rely on recall and self-reporting (Brown, Sellen and O’Hara 2000; Csikszentmihalyi, Rathunde and Whalen 1993; Gennip, Hoven and Markopoulos 2015).
The development of ever smaller and cheaper sensors, which can be embedded within products brings about new opportunities for industry and researchers to understand how objects are used in the wild. Here we investigate how to enlist connected devices that track the ways they are used as co-ethnographers. These devices transmit live data in order to reveal the motivations, behaviours, and contexts that frame product use. We investigate how to empower the lead researcher to take a more active role in remote research, than is possible through contingent experience sampling methods and thing ethnography, by continuously observing live data and responding to moments of activity they would like to investigate through one-on-one interactions with participants.
This paper tests a method of combining sensor data with instant messaging in order to investigate the potential for live data to support design research. We test this method by carrying out a study on a series of Bluetooth speakers with embedded sensors and investigate the following questions:
- Can sensor data be used to complement and support design research by aiding real-time contextual inquiry?
- Can the data gathered from the sensors and participant-researcher interactions capture behaviours and attitudes that would be useful in the development of new design directions?
- How do participants experience the data gathering process?
With this paper we contribute a novel method for remote design research that supports real-time contextual inquiry and a study testing that method. The method captures rich contexts of use and design insights. We further discuss considerations for the value, ethics, and future developments of the method.
BACKGROUND
This research draws upon contemporary design ethnography and in the wild HCI research practices.
Ethnographic methods utilising remote data capture
While traditional ethnography “is a methodology used to represent the perspective of everyday life” in order to gain an empathetic perspective of a culture, design ethnography aims to gain rich insights into the lives of people with the intention to find design solutions that cater to their needs (Salvador, Bell, and Anderson 1999). Design ethnography gathers rich contextually grounded qualitative data, but requires immersion, fieldwork and observation, which are time and resource heavy. Digitally collected data is becoming an increasingly important aspect of research, with areas such as digital sociology illuminating many aspects of lived experience (Orton-Johnson and Prior 2013). As ethnographic practice shifts towards the digital, Julia Haines (2017) argues that a holistic picture can be gained through multidimensional ethnography, accounting for a “variety of experiential spaces and how those spaces are integrated into the lives of those we study”.
An exploration of non-human agency within ethnography reveals how smart objects and data can be brought in as co-ethnographers within research practices in various configurations. Object Oriented Ontology (OOO) is a philosophical movement developed by Graham Harman, where the word object is used to represent everything as a separate independent but interdependent thing, including material things, individuals, and abstract notions. OOO accepts the inaccessible essence of objects (Harman 2016), and that objects are reducible to their interactions with other objects (Harman 2011; Harman 2012). To explore these notions further Ian Bogost (2012) developed alien phenomenology, a practice of exploring these object-centred perspectives through the use of metaphors. This inclusion of non-human things on an equal footing has prompted the development of remote ethnographic techniques centred on objects (Giaccardi 2016a). Thing ethnography offers a remote method to develop an in depth understanding of how objects are used in the wild, where embedded cameras and microphones allow things to act as co-ethnographers in a research process (Giaccardi 2016a; Giaccardi 2016b). Adopting a “thing perspective” can highlight new and surprising uses and relationships between people and things, but the process can be invasive due to the types of data that is gathered (Chang et al. 2017).
Similarly, ethno mining (Anderson et al. 2009) combines ethnography and data mining, putting quantitative data collected from sensors alongside qualitative data in order to develop an understanding that neither dataset can provide on its own (Aipperspach 2006; Churchill 2017). The method visualises sensor data post-hoc and uses it as a retrospective prompt for reflection and discussion in contextual inquiry interviews with participants (Aipperspach et al. 2006; Anderson et al. 2009; Bhavnani et al. 2017). Ethno-mining benefits from its unobtrusiveness, where the participant’s activities are not disrupted. However, the success of the method relies on the ability of the participant to recall past events and understand abstracted data, which may compromise the accuracy and detail of their interpretation (Freeman, Romney and Freeman 1987).
These contemporary ethnographic practices are exploring ways to conduct research remotely, allowing researchers to be co-present, rather than co-located (Anderson et al. 2009; Giaccardi 2016a; Giaccardi 2016b; Tallyn et al. 2018). They gather rich insights about human behaviour in the wild but are subject to several issues when collecting data about participant experiences. Ethno-mining and thing ethnography collect participant reflections outside the contexts that are being studied (Aipperspach et al. 2006; Churchill 2017; Giaccardi 2016a; Giaccardi 2016b; Hutchinson 2003; Odom et al. 2016). They often use interviews and participant feedback post-hoc, which affects recall, allowing participants to forget ephemeral reflections or be affected by the way data is presented (Gennip, Hoven and Markopoulos 201; Hoven 2015). To eliminate issues around retrospective recall Bhavnani et al. (2017), suggest using ethno-mining data to prompt experience sampling in real time.
While both of these methods require post-hoc analysis and interviews, the Ethnobot project (Tallyn et al. 2018) uses a real-time natural language generation algorithm to intervene in participant’s activities, simultaneously prompting actions and collecting data through WhatsApp messages. Tallyn et al. (2018) developed and deployed the Ethnobot within an ethnographic study where participants communicate with a chatbot to carry out real-time reporting of participant experiences. Framed around a live event, the Ethnobot app sent participants pre-set and open-ended prompts and was successful in capturing rich and informative contextually grounded data.
By reconfiguring the relationships between researchers, participants, and data-collection objects, these methods offer compelling new ways to gather ethnographic insights with the aid of ever smaller and cheaper sensors embedded within products. This led us to investigate how a combination of live data collected through smart products, and prompts sent to participants in response to this data, can be used in real-time contextual inquiry into situated everyday life to support design led research, in line with the discussions raised by Bhavnani et al. (2017).
In-situ research methods
From HCI research methods, we primarily draw upon diary studies, experience sampling, and technology probes. We relate strongly to ‘in the wild’ methods, a diverse set of ways to collect, record and interpret data, driven by findings that in-situ participant experiences with technology vary from those recorded in a lab setting (Crabtree et al. 2013). Research products and technology probes explore the behaviours and attitudes of people around technology in the context of their everyday life (Hutchinson 2003; Odom et al. 2016). They are designed to be deployed into the wild in order to investigate a particular research question (Gorkovenko, Taylor and Rogers 2017; Odom et al. 2016; Tsai et al. 2014). Data about participant experiences are gathered from traditional interviews post-hoc (Gorkovenko, Taylor and Rogers 2017; Odom et al. 2016), and from the traces of use on the objects (Tsai et al. 2014). While data from the use of technology probes is used to elicit reflections from the participants after taking part in the study, diary studies and experience sampling benefit from contextually grounded data recording practices.
Diary studies give participants the flexibility to self-record their experiences and activities whenever it is suitable for them (Brown, Sellen and O’Hara 2000; Csikszentmihalyi, Rathunde and Whalen 1993; Mu?ller et al. 2015; O’Hara and Perry 2001), while experience sampling methods (ESM) prompt participants to record their experiences at key times (Csikszentmihalyi, Rathunde and Whalen 1993). A challenge for both methods is that their self-reported nature may compromise the accuracy and detail of the data. In diary studies, participants often self-report when it is convenient for them, and this retrospective recall may lead to reflections going unreported (Gennip, Hoven and Markopoulos 2015). Data capture may help with this, for example Gouveia and Karapanos (2013) explored lifelogging as an alternative to self-reported entries, where the participants were asked to review daily collections of media. With this kind of large data collection, the way that the data is organised and presented to participants affects remembrance (Hoven 2015). This points to a need for developing research practices that utilise remote data capture in the service of contextually grounded participant reflections. One example of this is the Datawear app (Skatova et al. 2015), which captures data through a camera and elicits reflections on images through experience sampling on a mobile phone. Skatova et al. (2015) carefully navigate ethical ideas around private and public by developing a practice of self-reflection where all personal information is stored locally on the phone and only reflections generated by the participant are sent to the researcher.
Of particular importance to our work is contingent experience sampling, which furthers the methodological exploration of contextually capturing grounded experiences through the collection of thick data alongside sensor data and standardised survey responses (Berkel, Ferreira, and Kostakos 2017; Evans 2016; Smets and Lievens 2018; Zhang, Zhao, and Ventrella 2018). Here the sampling is initiated algorithmically based on a variety of factors, including completion events, change in sensor readings, events on the device, and events external to the device (Berkel, Ferreira, and Kostakos 2017). While these methods offer compelling new ways to gather ethnographic and design insights, they often take ethnographers out of the real-time research. Instead they enable engagement with participants at a later stage of the process, often relying solely on data and algorithms to facilitate real-time feedback from participants. What remains, is to explore the potential to engage a human ethnographer in sensemaking and communication with participants live alongside data streams. In particular, our research contributes an understanding of where collaboration with algorithms is useful, and the configurations that best combine human and machine intelligence.
METHOD
The method presented in this paper supports real-time contextual inquiry around the use of smart devices by combining live data with communication between researcher and participant. The aim of the method is to support the development of design insights around smart products through the combination of thick and big data. This method is hoped to benefit industry by supporting research that helps make human-centred products that cater to the needs of users. It aims to give participants agency over the research process by taking on an active role within live reflection and the creation of knowledge (Kennedy, Poell and Dijck 2015). Finally, the method puts the ethnographer in a central position during the research process, allowing them to decide when to initiate communication, and gather data in a remote but co-present manner.
The method builds upon developments within contingent experience sampling, thing ethnography, ethno-mining, and Ethnobot. Similarly to thing ethnography it utilises objects as co-ethnographers, but avoids the use of cameras, microphones and GPS trackers in order to limit invasiveness. The method utilises an ethno-mining approach to collecting data throughout the research process, but in order to limit retrospective recall issues reflections about the data are prompted both close to the time of activity and in a post-interview. Like Ethnobot we use instant messaging to collect live reflections from participants in the contexts that are being studied, but that communication is prompted by live data. Finally, communication is triggered by activity, like contingent ESM, but the triggers can change and adapt to the developing questions of the lead researcher, and communication can be free-flowing and nuanced rather than based on pre-defined structured questions.
The process is as follows:
- An existing object is augmented with sensors. In order to both support the development of ethical research practices and minimise effects on participant behaviour we avoid collecting video, audio, and GPS data.
- Sensorized objects are then deployed in the wild where they are used by participants in the real life context that we expect to see the products.
- The objects stream live data to a specialised tool used by the research team, which visualises the data.
- Ethnographers monitor the data stream in order to spot moments of interest to probe and investigate. This process can be aided and supported by algorithms that alert the lead researcher when certain types of activity is seen within the live data. Throughout the study the sphere of interest would change and develop to reflect the development of a nuanced understanding of activity.
- Interactions with participants are initiated by the lead researcher. The researcher has agency over the process and may choose to probe moments of interesting activity observed within the data streams, in line with contingent experience sampling, or investigate the behaviours and motivations that frame activity more generally. Currently participants are contacted using instant messaging (IM), where a free-flowing communication can occur on a familiar platform. Participants are also encouraged to capture and share photos or videos of the object, which aids contextual inquiry.
- The sensor data and IM data are combined to build up a rich picture of the ways that participants interact with the objects.
- The data collected throughout the study, including communication, sensor data, and photos and images, is collected and used in a post-interview with each participant.
STUDY
In order to test the applicability of the method on developing design insights and an understanding of smart product use, we developed a collection of portable Bluetooth speakers containing sensors, to act as technology probes (Hutchinson, 2003). We chose to create portable speakers for various reasons, including ease of manufacture, and their potential to be used in a variety of contexts and with a variety of intents. We were particularly interested in how the use of the devices differed from participant to participant and if those differences led to varying design insights. The speakers streamed their orientation, acceleration, playback state, and currently playing track (Figure 1). Participants (n=13) were asked to take one of our speakers into their homes and use it for a duration of 10 days. They were asked to use it every day, for as long as they liked, and respond to the prompts that we sent to them via WhatsApp.
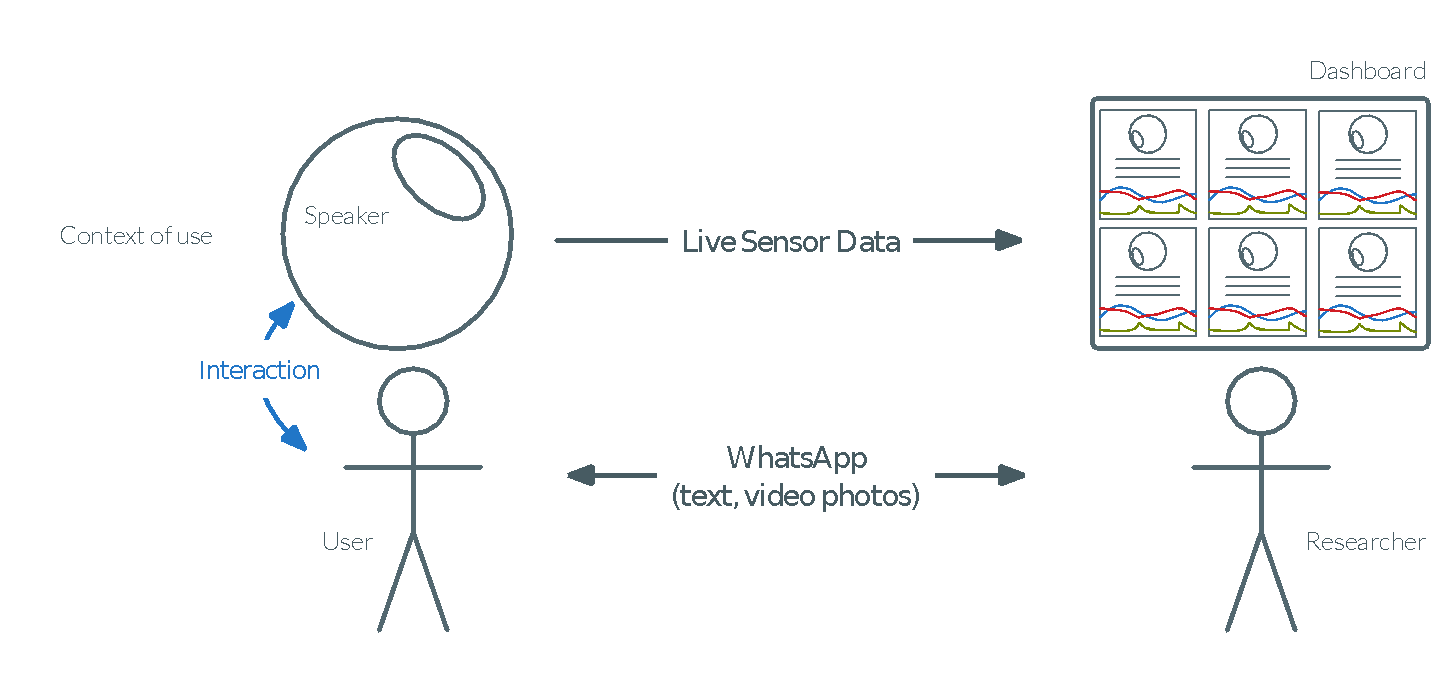
Figure 1. System overview, showing data flows between researchers and participants.
The data from the speakers was monitored using a custom-built dashboard. It utilised a series of digital representations of the speakers with their associated data, developed by Burnett et al. (2019). Whenever the participants used or handled the speaker they were asked questions specific to the data we observed. In times of no activity they were sent general prompts and questions about the study experience and their use of the speaker. The dashboard was continuously monitored from 10 AM until 10 PM daily for movement and audio data, and all communication was carried out by the lead researcher. Although the dashboard was monitored for long durations of time, the daily interactions of each participant with the lead researcher tended to be short. As a rough approximation, most participants took around 5 minutes per day, with a minimum of 2 minutes and a maximum of 34 minutes.
Bluetooth speakers
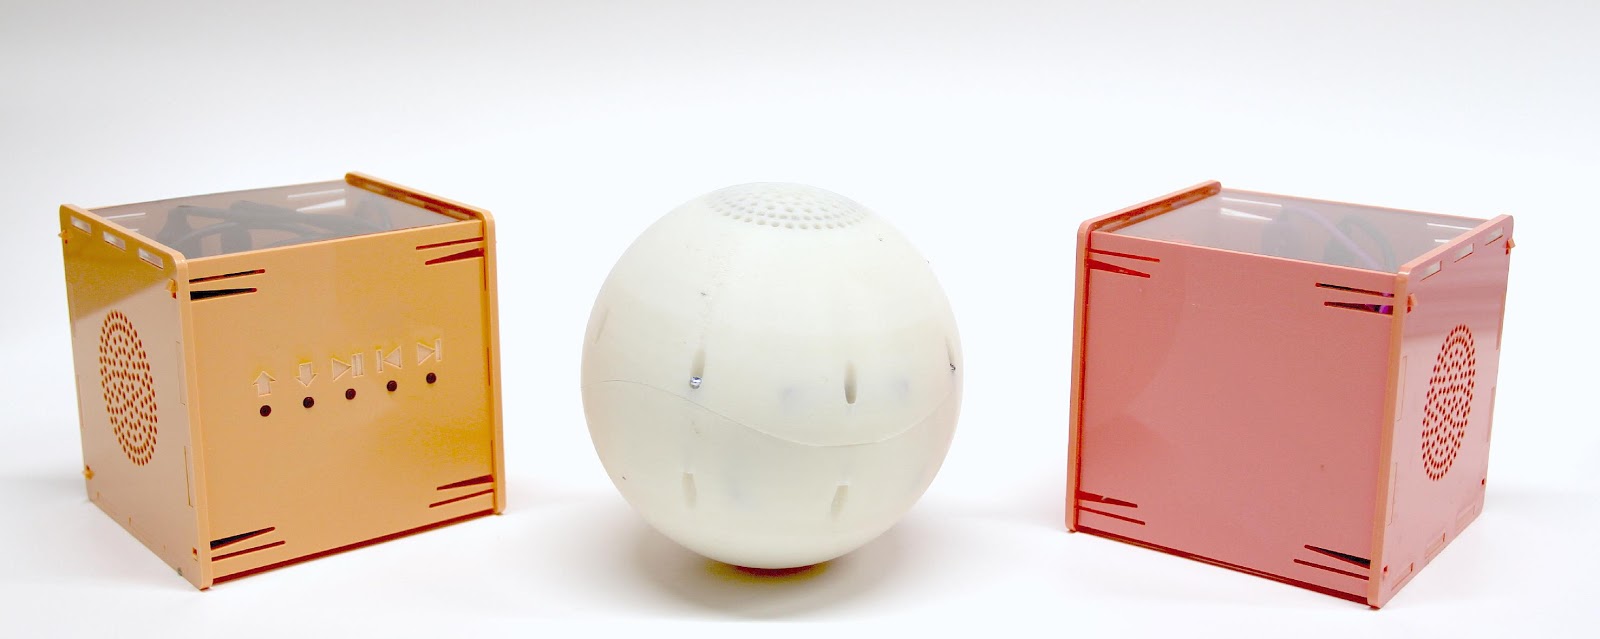
Figure 2. Three speaker designs. Left: cube with button controls; centre: sphere; right: cube with gesture controls.
The speakers are technology probes designed to investigate the potential of sensor data to support remote design research (Hutchinson, 2003). They worked as conventional Bluetooth speakers, playing any audio from a connected device. We created three different designs in order to examine how the design of the speakers affect how they are used (Figure 2): i) laser-cut acrylic cubes with volume and track control buttons; ii) 3D printed white spherical speakers with no controls; iii) acrylic cubes that responded to gestural controls, e.g. tipping forward to increase the volume. None of the speakers had an on or off switch, in order to continuously receive data. Inside they contained two paper cone drivers, a RaspberryPi ZeroW, and a 9-Degrees of Freedom, Inertial Measurement Unit (IMU) board, which measured the object’s orientation, movement, and acceleration, updating every 100ms. The speakers used WiFi to stream sensor data, archiving it for later transmission when no WiFi was available. The data was displayed on a bespoke dashboard containing a simple virtual representation of each device, which displays its spatial orientation, alongside sensor and playback data (Figure 3).
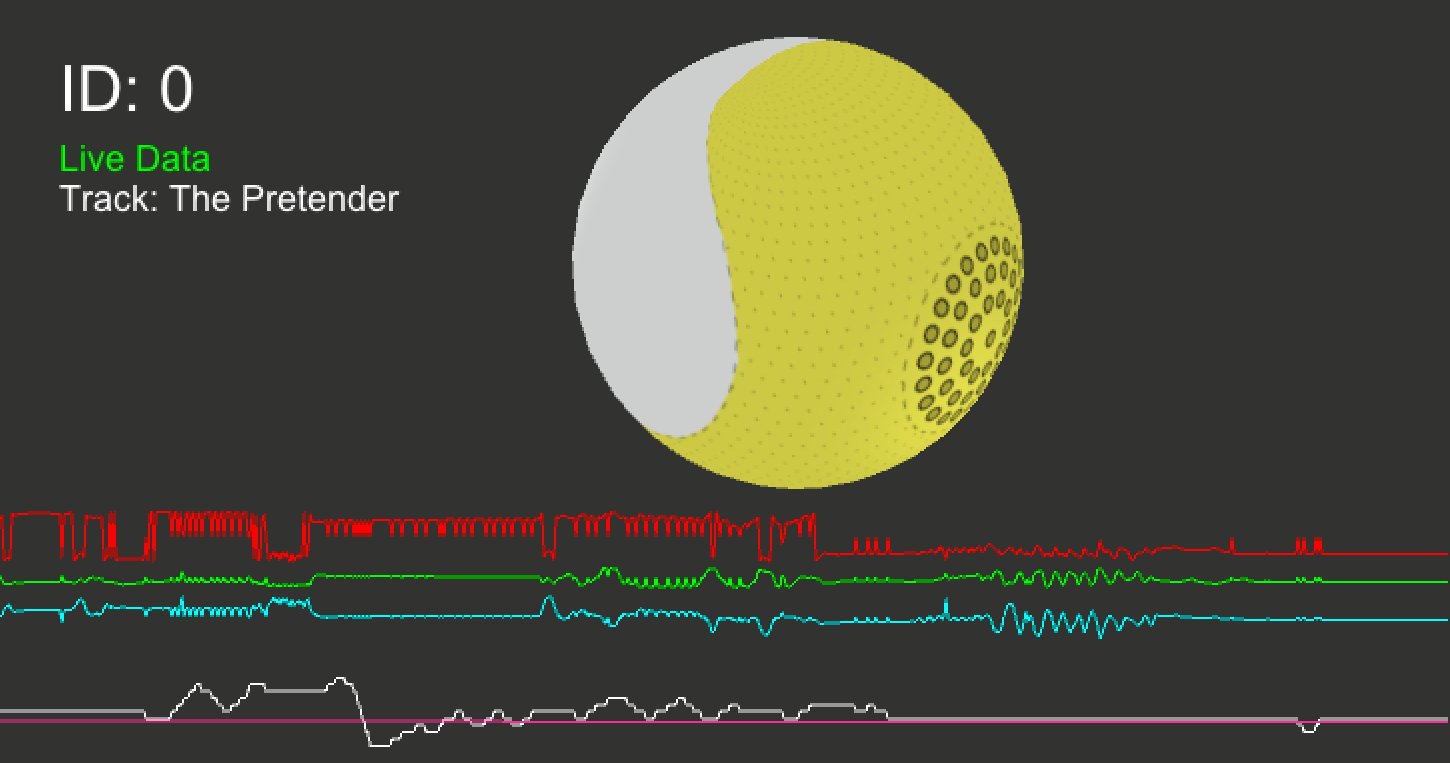
Figure 3. Example of a digital twin of a spherical speaker as displayed within the dashboard, showing a 3D model of the sphere, orientation on 3 axes (red, green, blue), playback volume (white) along with the current track.
WhatsApp interactions
The researcher used the dashboard to gain a real-time view of how the speakers were being used, informing communication and prompts with the participants through a dedicated project WhatsApp account. At regular intervals and also when something interesting occurred the participants were sent prompts. They each received between two and three prompts per day. The prompts could result in a short conversation or request for a photo or video. When the researcher observed activity on the dashboard, such as playing music, movement and changing volume, the participants were sent specific prompts relating to the data. Data responsive prompts usually contained some information about the data that was coming in, for example: “I can see that the speaker moved. What did you do with it?” or “I can see that you have been playing an audio file but there is no metadata, what have you been listening to?”. The rest of the prompts asked general questions about the experience, such as “Have you tried using the speaker for anything other than music?”. The prompts included an array of questions aimed to probe how the participants felt about using the speaker, where they used it, what activities they used it for, what else they did while they were using the speaker, and how they felt about the research process. These exchanges aimed to elucidate the context, behaviours, and motivations framing moments of engagement.
Participants, data collection and analysis
The study was carried out with 13 participants, for 10 days each. Eight of them were female and five male. The majority of participants (N=11) were recruited through university emailing lists and included a combination of undergraduate (N=1), masters level (N= 5) and PhD (N=3) students, as well as university staff (N=2). Another two participants were recruited through word of mouth. Before the study, each participant carried out a pre-interview (5-15 minutes) and consent process, with a longer (20-60 minute) semi-structured interview at the end. The participant’s audio listening habits varied, but all reported they listen to music, video, audiobooks, or radio, on a daily basis and felt they could incorporate using our Bluetooth speakers into their pre-existing listening habits.
For each participant we collected:
- Sensor Data: 3D accelerometer, magnetometer and gyroscope data.
- Audio data: track, artist, and album names; control events – track skip/rewind, playing/paused status; volume changes.
- WhatsApp data: text logs along with photos and videos.
- Pre/post interviews: audio recordings with anonymised transcription.
All data collected on the devices was time-stamped, with a flag to indicate whether it streamed live or stored and streamed later if the device was out of WiFi range.
A thematic analysis (Braun and Clarke 2006) of the interviews, WhatsApp interactions, photos, and videos was conducted using Nvivo. The data was coded using the software by the lead researcher. It was then refined and clustered into themes by two of the researchers until the final themes were agreed upon.
RESULTS
The study resulted in 380 WhatsApp prompts in total, of which 63 were sent in response to activity observed on the Dashboard. Below we outline the three major themes that emerged from the WhatsApp interactions and the interviews: uses, design opportunities, and reflections on participation. The first two themes relate to the experience of the participants in relation to the speakers, while the last theme relates to the participants’ self-reported experience of the process. Throughout the results, we present quotes and summaries extracted from the qualitative data, supported by quantitative data visualisations where appropriate. Quotes with timestamps in the form of [hh:mm:ss] are taken from WhatsApp chat logs; those without are from post interviews.
Uses
Continuous communication with the participants revealed how, where and why they used their speakers throughout the duration of the study. The interactions that were prompted by activity seen on the dashboard, largely related to movement, such as when the speaker was picked up. Most participants kept the devices in their homes, with only P9 taking his to work to listen to music and P3, who had a spherical speaker, taking his to the park to juggle with.
Most of the participants described using the speakers for listening to music in the background of other activities, commonly alongside getting ready in the morning, cooking, working, and doing chores. They also described listening to podcasts, news and audiobooks. A combination of metadata and conversation revealed a range of devices connected to the speakers including smartphones, tablets and laptops. Similarly, the participants reported using 9 different applications, including Spotify, iTunes, and Netflix, with metadata giving clues and opportunities for discussion:
<[19:53:39] Researcher: I can see that you have been playing an audio file but there is no metadata, what have you been listening to?
[19:54:20] P11: I’ve been streaming Chinese songs on Apple Music>
While all participants listened to audio on a daily or near daily basis, only P1, P5 and P8 owned Bluetooth speakers and could build on existing habits:
P1: “… I use one all the time in my personal space … I didn’t feel like I had to adopt a habit around a speaker, because I already had one.”
Some participants had regular patterns of use, such as P1, who (with two exceptions) used her speaker daily in the late morning, while others (e.g. P9) had less structured timings (Figure 4).
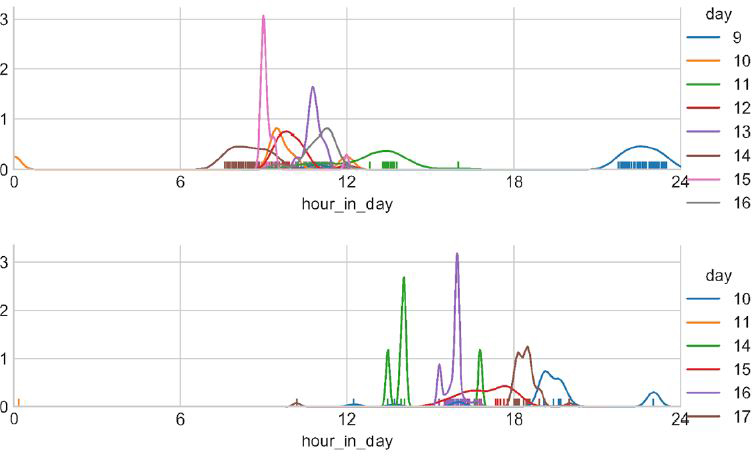
Figure 4 Daily habits of P1(top) and P9 (bottom), showing activity (track changes, playback start/stop) with lines illustrating periods of maximum activity. Each color represents a different date within the study.
The portability of the speaker encouraged movement to complement situated activities. For example, P7 used the speaker in five different locations around his living space. These included i) the living room while working ii) the kitchen table while eating iii) the bathroom while shaving and iv) the bedroom while doing chores. These movements were captured through live data, supplemented by requested photos (Figure 5).
<[10:21:28] Researcher: Hi the data shows that you moved the speaker. What did you do with it?
[11:14:23] P7: I moved it to my bedroom as I was doing chores there and used it to listen to music>
In the final interview P7 reflected on how portability allowed new habits to form: “It was connected to my phone, I just moved the speaker. I think it improved my listening to things in other rooms a lot”.
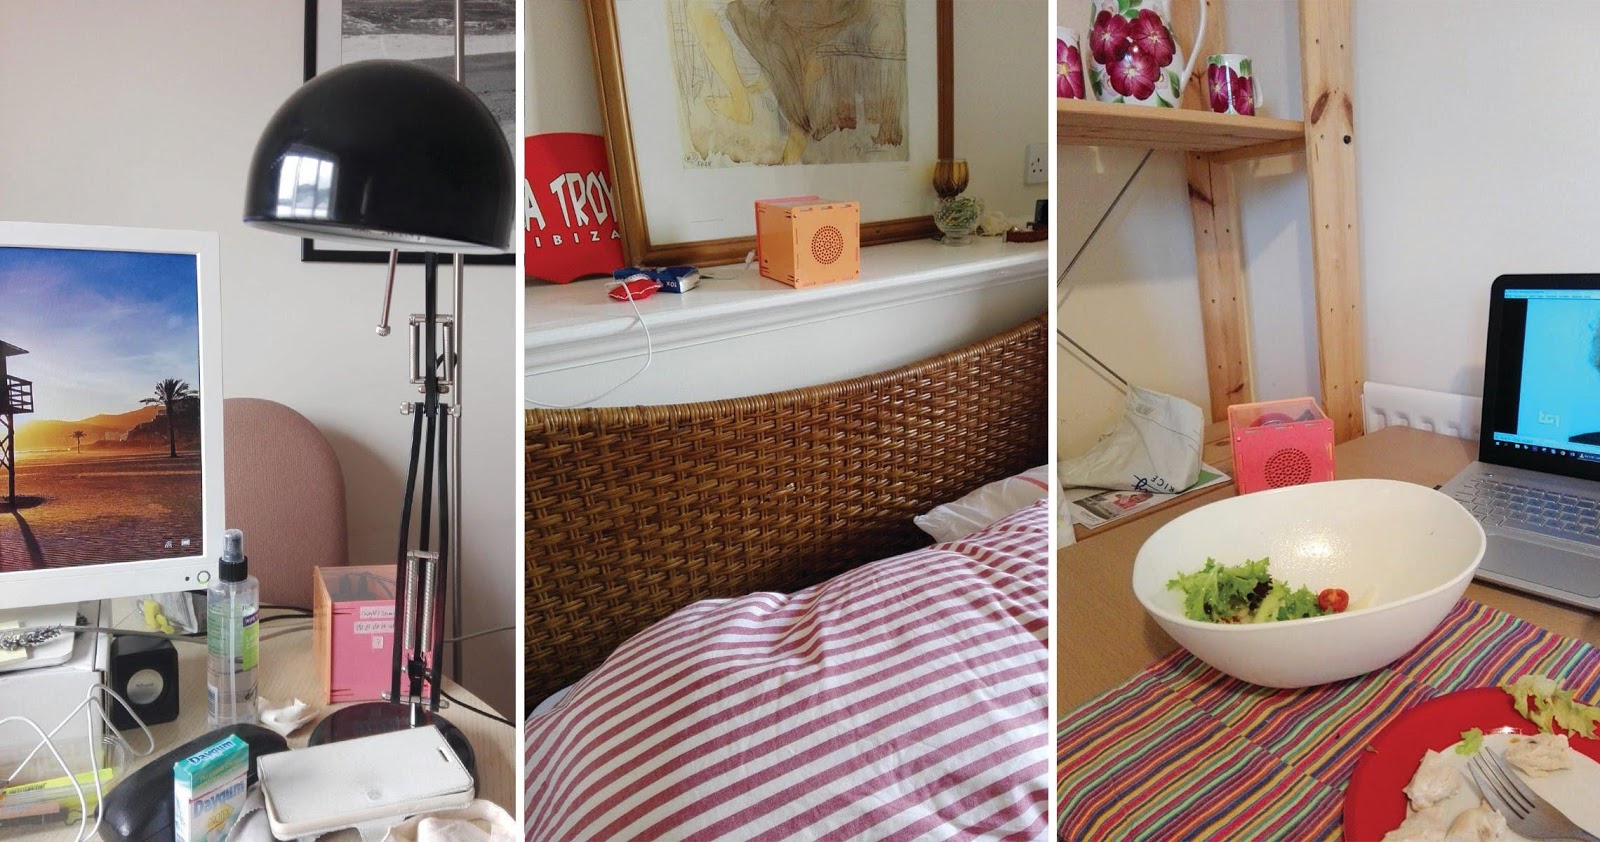
Figure 5 Speaker usage in the wild with P7, showing its use while working (left), alongside bedroom chores (centre) and while eating dinner (right). All images taken by participant and used with permission.
In contrast, although P4 played music in the mornings as she would normally do with her phone, she never moved the speaker, preferring to leave it static. This was due to her small student accommodation living space. Gaps in the data stream could indicate use and location, when supported by WhatsApp communication. For example, P9’s speaker disappeared every morning after a burst of movement. Questioning around these disappearances established that P9, who manages a small art gallery, took the device to work, where it could not send live data. The speaker was used as the primary gallery audio throughout the work day, and photos collected showed that it was located either on the counter where it was charged or on a shelf where it could be better heard by customers. When the device showed up playing music through the day, the researcher could deduce that P9 had a day off.
Design opportunities
The WhatsApp interactions aimed to explore design opportunities for the speakers by investigating the ways they meet the needs of the participants, and they ways they do not. One issue was battery life, with many participants resenting having to charge the devices each day. This resulted in multiple requests for a power switch:
P10: “that’s the thing that annoyed me a bit, that it didn’t have an on and off button, because I don’t like to leave stuff connected all during the night.”
All of the participants complained about the sound quality of the speakers. This prompted some to use the speaker for audiobooks and podcasts instead of music (P4, P6, P12), or deterred them from using it (P3). While P11 thought it sounded like a budget speaker. They reflected that although listening to Western songs with the speaker was unsatisfying, it may have sounded better with Chinese songs due to the phonetic differences between the languages.
P11: “I have been tending to listen more to Chinese songs during the study, and I realised that for some particular Chinese songs, it actually sounds better on this than the other expensive speakers.”
The three different types of speakers encouraged slightly different ways of interacting with the objects. The spheres, used by P2, P3, P5, and P12, were seen as playful and robust, and often sparked the imagination of the participants. They all enjoyed aspects of the shape, colour and materials of the speaker, P5 described how it gave her a “pleasant and calming feeling”. Some participants explored alternate uses for the speaker like P3 who experimented with using the spherical device for contact juggling, suggesting that it needs to be slightly smaller and lighter, but that the shape is extremely beneficial for performances. Meanwhile, P2 saw the speaker as “a lazy cat”:
P2: “Reminds me a bit of my record player – it’s like having another sentient being in the flat. It plays the music but also feels like it simultaneously provides a form of company while you then listen to it.”
While pleasing, the spherical design was somewhat awkward. A conversation prompted by movement revealed that P5 had had moved the speaker to the kitchen where she was making dinner and sent a video of it wedged behind the kettle in order to balance it (See Figure 6, left). In the final interview she reflected that if it was made out of more rubbery material it would be easier to balance.
In contrast, the cube shaped devices were often perceived as fragile, which affected how they were used. This was partly due to the construction, which made the participants feel as if “the walls could fall apart” (P1) and partly due to a transparent panel making the internals visible:
P8: “I was a little scared of breaking it, just because, you know, I guess, when you can see the insides of something, you’re like, “Oh, it might be more delicate.”
The speakers did in fact fall apart on several occasions. The process of communicating throughout the study helped us identify issues in real-time, and support the participants in fixing them. P9 who took the speaker to work using his backpack every day broke his speaker twice, once in his bag, and then again in the shop by accidentally pushing it off the counter (See Figure 6, right). Several other issues occurred requiring resets and rebuilding: the speakers belonging to P7, P4 and P6 stopped working, P9 and P3 dealt with various volume and Bluetooth connectivity issues, and P7 had to reconstruct his speaker when it fell apart in his hands. Participants who reconstructed and explored the speakers reported that they felt more attached to them as a result of the experience (P6, P9).
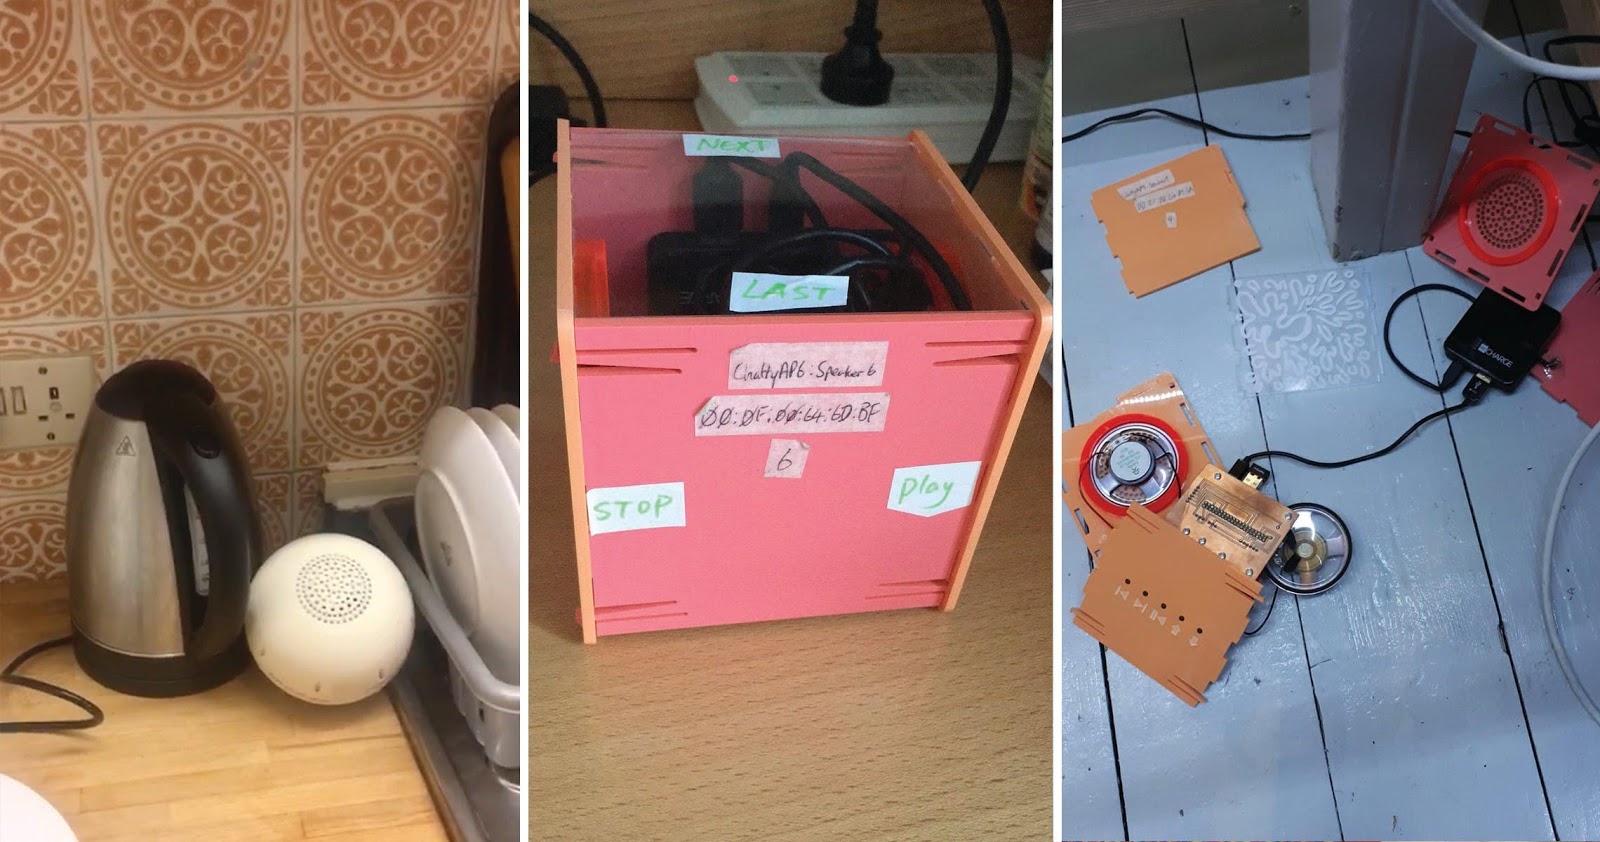
Figure 6 Strategies for working with the speakers. Preventing rolling by wedging with a kettle (left), annotating with gesture commands (centre), speaker accidentally broken by a participant (right). All images taken by participants and used with permission.
The cube-shaped speakers could either be controlled through buttons, belonging to P1, P8, P10, P9, and P11, or by tipping and twisting the speaker itself, belonging to P4, P6, P7, P13. The buttons on the speakers were seen as too stiff or too small (P9, P10). P11 simply ignored them preferring to use his phone to control playback. While P1 felt that the buttons were especially useful when she was in the bathroom and did not want to get her phone wet.
The gesture sensitive cubes received a mixed reaction. P7 enjoyed being able to control the speaker by manipulating it physically and described leaving his phone in a single location while taking the speaker around his home. P4 and P6 found that the interactions were too sensitive, activating when the speaker was relocated. There were no visual indication for the direction of controls, and P6 found it hard to associate gestures with the position of the cube. The repeated attempts at gestures showed up on the live sensor data, and in the ensuing WhatsApp conversation, we discovered that she was addressing the problem by adding her own annotations to the device (see Figure 6, centre):
<[19:34:37] Researcher: I can see you are moving the speaker. Are you relocating it to the bathroom now?
[19:36:09] P6: Nope. I’m trying to use it to control the music I want to play
… [19:36:49] Researcher: Did it work?
[19:37:04] P6: Not so well.
… [19:47:51] P6: I made signs on the Object to indicate the interactions.>
The transparent panel on the cubes allowed participants insight into the device’s internal states—lights on the battery pack helped P1, P6, P9 and P13 understand charge, and a blinking blue light from the WiFi dongle revealed when data was being sent. P9, who accidentally broke his speaker twice, used the lights to aid reassembly:
P9: “Every time you put it back together, you’re looking for all the lights. You’re like, “Okay. There’s the power pack light. Where’s the green light flashing? Where’s the blue light? Why isn’t the blue light happening?” It’s quite fun.”
Finally, the speakers we collected at the end of the study contained multiple traces of use. Some of them indicated issues with the design, such as the labels made by P6 and a multitude of broken spring clips, while P9’s was decorated with an intricate pattern, indicating how he personalised and took ownership of the speaker.
Reflections on participation
The participants’ perceptions of the experience of taking part in the study varied depending on how comfortable they felt with the lead researcher monitoring the data coming in, how they viewed the WhatsApp interactions, and to what extent they found the speaker useful. Some participants (P1, P7, P8, and P10) felt that they used the speaker based on their pre- existing listening habits, and did not find the WhatsApp prompts disruptive or the study invasive. Others were affected by the feeling of being observed and were mindful of how they used the speaker. Six of the participants described listening to more music than usual at the start of the study. Beyond our stipulation that they use it daily, some participants described consciously trying to provide us with as much data as possible:
P13: “first few days, I was more conscious of trying to use it a lot, and then the other days, I was just using it when I would normally have music on”
Others imagined that the lead researcher would listen in on what they played through the speakers. P2, P6 and P9 even found themselves feeling like they were creating a playlist for the lead researcher. They reflected on their listening habits, what aspect of their identity they were presenting through their playlists, and what could be inferred about their emotional state. P2 and P9 felt compelled to not listen to songs on repeat, and P2 reported that he enjoyed exploring his Amazon Music collection in a new way.
P2: “I probably have thought somewhat more about variety of selection than I might otherwise have done. ‘I just played that, so let’s now have something different’: it’s almost as if I convince myself that those capturing the data are in effect also listening to the music themselves.”
Asking questions based on live data was sometimes reported as invasive due to the connection to activity:
<[15:03:51] P4: It’s not too bad, at times I find it invasive because I’m being asked what I’m doing even though my movements are not being tracked by the device>
While seen as invasive, the WhatsApp interactions also helped the participants whenever issues occurred with the speakers. P6 who’s speaker was connected to her phone via Bluetooth but did not play music, reported her issue to the lead researcher. Based on the researcher’s suggestion she opened and rebooted the device, which fixed the issue (Figure 7).
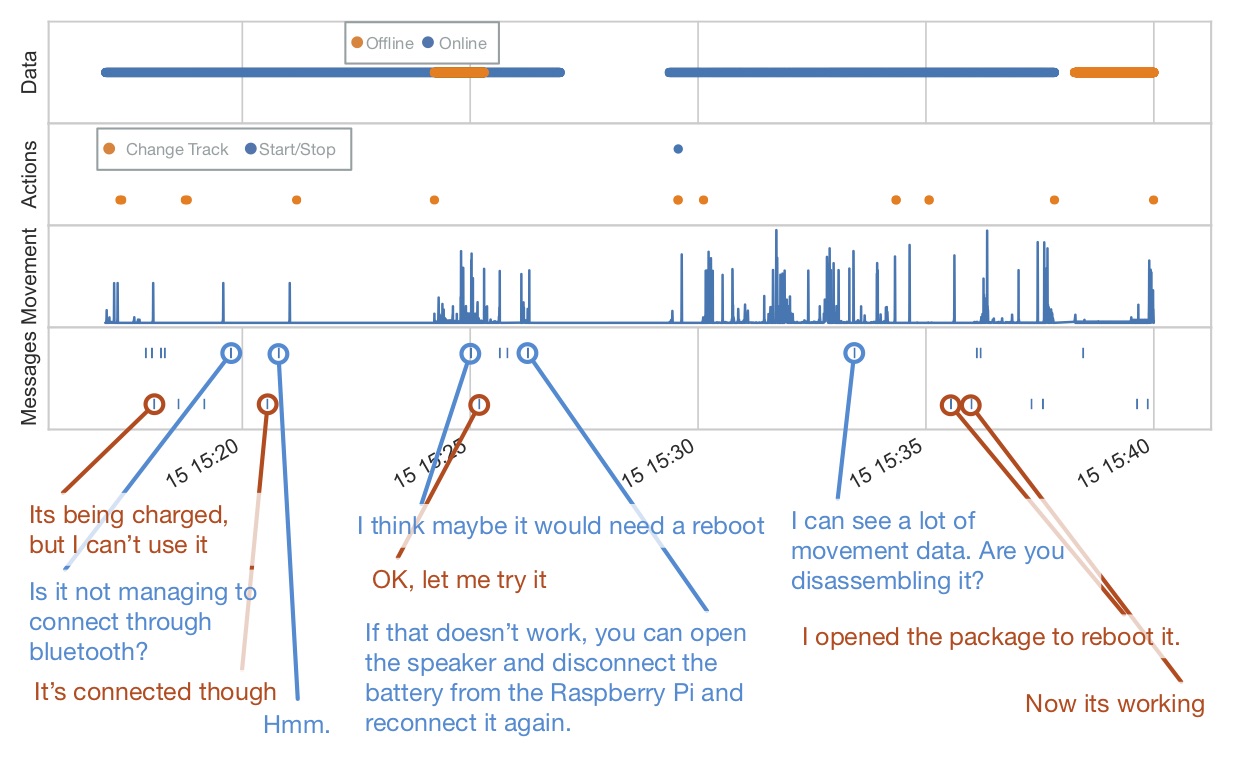
Figure 7 Annotated graph of interaction with P6 around fixing and rebooting their speaker.
Some participants (P5, P6) felt stress about complying with the study demands, which contributed to a somewhat negative experience. P6 worried about forgetting aspects of her experience, striving to provide us with “immediate feedback, which [she thought] is more reflective and more detailed”. In some cases, participants avoided using the speaker as they knew they would be messaged, e.g. P5 did not use the speaker when her friends were round, as she did not want to respond to messages. P5 also reported towards the end of the study that she had a nightmare, where she had received a photo of herself through WhatsApp that was taken from the perspective of the speaker.
In light of the discomfort some participants experienced, we asked them how we could have made the process less intrusive. There was a consensus that the real-time questions were necessary in order to get an accurate understanding of how the speakers were used. P5 felt that having a bot carrying out the WhatsApp interactions may make the process less emotionally taxing, while P2 felt that communicating with the lead researcher was more personal and less disturbing than with a bot or machine:
P2: “There was a face I could put to it. I felt more that you were enquiring. I think if it had all been automated I would have felt that something or someone was observing in the much more loaded, negative sense.”
Finally, several participants (P1, P4, P7, P13) felt that taking part in academic rather than industry research made them more trusting and forgiving of the inconveniences of the process.
DISCUSSION
The method we present draws from ethnographic and experience sampling methods where things act as co-ethnographers, the possibility of real-time responses to data, and the algorithmic processing of data streams to generate insight. Within the results, we explored how live sensor data prompted exchanges with participants about the contexts in which they were using devices in the wild. Here we will discuss how this method revealed rich contexts of use, highlighted design opportunities, and the experiences of participants. We further discuss how we would develop this method further.
Value of method
RQ1 Can sensor data be used to complement and support design research by aiding real-time contextual inquiry?
Contextual inquiry
From the point of view of contextual inquiry, being able to interact with the participants directly resulted in a collection of photographs and videos of devices in use. From Figures 5 and 6 we can see a range of domestic situations, with the devices part of the landscape, rather than being posed performatively. The value of immediate communication was particularly apparent in the interaction with P5, where motion data triggered a conversation that resulted in a video of the speaker wedged between a kettle and a drying rack. This was somewhat unconscious, and not reported in text, but was captured by a video requested in response to data. The ability of the lead researcher to dynamically engage with participants helped reveal this unreported behaviour, which may have been missed by contingent experience sampling.
Where past research has identified that experience sampling, and diary studies can miss details of the contexts that are being explored (Csikszentmihalyi, Rathunde and Whalen 1993; Gennip, Hoven and Markopoulos 2015; Hoven 2015), this method facilitates communication close to the time when the activity is occurring. We are interrupting people’s activities and prompting reflection in the moment, trading off between participants’ ability to recall and the intrusiveness of being asked about what you are doing. The method borrows strategies adopted by contemporary design ethnography, including ethno-mining where data is used as a discussion point in participant interviews (Aipperspach et al 2006; Churchill 2017), Thing Ethnography where sensors are attached onto a product turning them into co-ethnographers (Giaccardi 2016a; Giaccardi 2016b), and the Ethnobot tool where live communication with a participant is facilitated throughout the duration of the study (Tallyn et al. 2018). Combining these strategies allows us to tailor prompts sent to the participants based on the incoming live data, which allows us to investigate the contexts, behaviours, and motivations that frame the use of the speakers. Through a combination of reacting to participant activity and semi- regular sampling we gained a comprehensive picture of how the device fits into the user’s habitus.
Emerging behaviours
The devices that we deployed were idiosyncratic, and as such, the study revealed several strategies that the participants adopted to deal with the slightly unwieldy devices, such as P6 placing signs on her speaker. The ability to rapidly spot new behaviours allowed us to see the very first steps that users took to overcome problems, developing a temporally situated view of their process.
From a research point of view, this is somewhat challenging, as the discussion affected the participants behaviours. However, from a design and development perspective, it allowed us to reassure the participants about modifying the devices, offer problem solving advice, and identify design opportunities.
Ground truthing sensor data
While the WhatsApp communication, including texts, images and video, gave us an opportunity to discuss the contexts of use and the participants reflections, the live data allowed us to see patterns of behaviour emerging. By combining these two data sources, we were able to ‘ground truth’ the sensor data against reported activity. A key example is when the volume setting on P1’s speaker repeatedly jumped between two different levels. By prompting for a discussion about this, we learned that we observed these volume jumps when they switched the audio source from their iPad to their phone, which had the volume output set at different levels. This would lead naturally to an understanding of when and how participants use different devices with the speakers. Similarly, we could see periods of movement, coupled with the device going offline shortly after – conversation with participants indicated they carried the speaker in a bag to work. Through this combination of big and thick data the lead researcher was able to gradually build an understanding of the live-stream, developing more nuanced questions as the study progressed.
By adopting a thing perspective through a research process centred around sensor data emitted by the object and conversations emerging in response to this data, we developed an understanding of the relationships that developed between the technology probes and the participants. Where ethno-mining attaches meaning to data post-hoc allowing for misinterpretations on the part of participants (Aipperspach et al. 2006; Churchill 2017) questioning participants close to the time of activity allowed us to ground truth our understanding of the sensor data.
Co-creativity and instant reporting
A side effect of our frequent interactions with the participants is that it gives them the opportunity to become collaborators in the understanding and development of products. This is an effect that has not been explicitly stated or observed within the research methods we build upon. After some prompts, several participants became keen to send in photos of the ways that their speakers had gone wrong, or had been personalised, becoming proactive in their reporting. This shifted the relationship between participants, the researchers, and the devices. In most cases, it opened up spaces for discussion and experimentation, in particular allowing us to reassure participants that repairing or altering the speakers was allowed. In one particular case (P1), the participant grew to expect responses from the researcher every time they used the speaker, and noticed times when there was a lack of prompts. The overall effect was to give participants greater agency over design process, building on their reflections and enlisting them in carrying out sensemaking around their experience (Mols, Hoven and Eggen 2016). We could capture insights as they happened, and interactively investigate them, rather than relying on retrospective recall. This shift in dynamics allowed participants to change the flow of information from themselves to the research team, accessing information and assurances as they need them. By leveraging reciprocity and communication within the research process, participants can become personally invested in the process.
Relating to design
RQ2 Can the data gathered from the sensors and participant-researcher interactions capture behaviours and attitudes that would be useful in the development of new design directions?
Capturing user improvements
The WhatsApp communication revealed user’s ad-hoc improvements, suggesting ways that the speakers could better address the needs of the participants—for example P6 adding labels to their speaker. The significance here is that the user innovation required to temporarily resolve this issue was not apparent in the real-time data stream, and could have easily been missed without time consuming post-study interviews. The ability to capture user improvements, product hacks and suggestions via real-time communication may provide significant value in accelerating product innovation. This occurred in the context of quite shallow relations between the researcher and the data stream – with a more developed data processing system, conversational triggers could be targeted, based on inferred novelty.
Opening up communication between industry and consumers may extend the lifecycle and desirability of products. It is estimated 78% of products are still functional when disposed of (Ceschin and Gaziulusoy 2016). By identifying easily fixed faults and providing remote troubleshooting and directions for repair by users, we can prevent premature disposal of products. However, it will also be possible to evaluate user interactions during these periods and use the insights to make subsequent product iterations easier to fix by re-design of parts.
Data driven design
Various studies have demonstrated the power of combining product simulation with generative techniques to discover new design solutions (Matejka et al. 2018). However, a key limitation of these works is that the quality of the solution is closely related to the quality, accuracy and speed of the simulation method. The approach outlined in this study could open up new possibilities of performing large-scale A/B testing and product evolution in relation to real-world usage insights.
Within this study the attributes of the dashboard drove the researcher-user interactions. Specifically, the dashboard provided detailed data associated with speaker movement, which became the main identifier for novel user behaviours. A significant area for further investigation is to explore how to best visualise and interact with product data across different needs and disciplines, e.g. designers, engineers, and end users (Mortier et al. 2015). The use of machine learning has the potential to categorise and identify patterns within the data and identify novel and unexpected behaviours. We further suggest a participatory approach for the creation of dashboards with designers in order to target features of relevance and interest.
Data gathering and participant experiences
RQ3 How do participants experience the data gathering process?
One major area of concern is that the process was invasive – participants became used to being questioned after every movement or interaction with the devices. If this was positioned as a pure ethnographic method, the level of disturbance could be problematic. While some level of disturbance is warranted (Crabtree et al. 2013), particularly as it engages the user with the design process, a longer-term study, with a lower frequency of interaction is clearly of interest.
A crucial part of collecting data in the wild is dealing with the ethical issues framing the experiences of participants. The invasiveness of the study, their level of comfort, and their willingness to engage are affected by the research process. Situated data gathering in particular tends to become both personally identifying and intimate (Canzian and Musolesi 2015; Montjoye et al 2013). This affected our choice of sensors; where previous Thing Ethnography and experience sampling work used broad data capture devices such as cameras and microphones (Chang et al. 2017; Giaccardi 2016a; Giaccardi 2016b; Skatova et al. 2015), we used sensors that were minimally identifying. Furthermore, understanding how that data can benefit and create value for industry raises questions about consumer exploitation, as raised by Zuboff (2015). It is thus imperative to give greater agency over the research process and data collection to participants. Here participant agency could take on a multitude of different processes that shift power from the researcher and manufacturer to the participants, primarily in understanding the data streams they generate and in being able to control them (Kennedy, Poell and Dijck 2015). One way explored by the HCI community is to store raw data locally and to give users the ability to only share reflections or the results of algorithmic processing (Crabtree et al. 2018; Skatova et al. 2015). For the purposes of our method, only sharing reflections as initiated by the participant diminishes co-creativity and the ability of the researcher to identify moments of interest and engage in conversation alongside those moments. Instead we view an opportunity to explore how participants can be given greater agency over who sees their data, how it is used and analysed, how it is understood by researchers.
Some participants reported that they were not influenced by the data gathering, while others experienced stress. A similar variety of reported participant experiences regarding ideas of privacy were also observed within a study by Oulasvirta et al. (2012) where a surveillance system was installed in the homes of 10 participants for the duration of a year. The discomfort around data collection in pervasive surveillance diminished with time even in those negatively disposed towards being continuously monitored (Oulasvirta et al. 2012). While a longer deployment of our study may have resulted in a similar plateau of relative comfort with the data collection process, the continuous use of messaging prompts and interaction with a present researcher may affect the participant’s ability to ignore the data-collection.
Issues remain around consent—in particular, when objects exist in shared spaces, it is impossible to gain informed consent from every visitor to the space. This is somewhat ameliorated as we are not able to immediately identify a portion of the data stream as being due to the actions of a particular person. We believe that a split we make here can prove a useful model for data gathering in a more humane manner: passive capture vs active report. Passive data collection should be minimally invasive, aiming to capture information about the device, rather than the user. In contrast, identifiable, personal capture is should be carried out actively, giving the user an understanding of the process, and offering opportunities for explanation and collaboration around the way that the data is interpreted. This develops the idea that ethical practices can lead to better results, as users are happier to share and researchers or developers can reduce the sense of data colonialism (Thatcher, O’Sullivan and Mahmoudi 2015).
Going beyond the capture, we need to understand what can be inferred from the data, and how participants could possibly consent to this. Some participants altered their song choices to avoid disclosing their emotional state to the researcher (in Reflections on participation), but it is extremely plausible that these sensorised devices start becoming more emotionally acute, especially when working with longitudinal data. Users are often unsure of what is being collected at a basic level (Makinen 2016), although they may often willingly participate in surveillance (Ellerbrok 2010), often with incorrect mental models of what can be inferred from the data (Rader, 2014). With respect to music listening habits, the sharing of music being played forms a part of identity management (or profile work (Silfverberg, Liikkanen and Lampinen 2011)), so it is not surprising that some participants were concerned about this. These all raise the issue of contextual integrity (Nissenbaum 2004) as a crucial determinant – how does the use of the data captured relate to the context within which it was captured. Where participants were able to engage with the research, they could gain reassurance about what was being collected, but for longer deployments, or for products with users as opposed to studies with participants, more participatory approaches would be useful – helping users understand what is being learnt from their data.
Agency within the research process
When examining the agency of the participants, researchers, sensorized speakers, and the data visualization tool, we see how their interconnected roles shape each other’s actions. A more speculative examination of this can be found within our future-oriented theoretical paper on Entangled Ethnography (Murray-Rust et al. 2019). In this study, the ethnographer interprets live data streams, facilitated by the dashboard and sensors, and gradually builds an understanding of the participant’s habits and feedback. Throughout this process they have control over initiating interactions with the participants and probing their motivations and conceptualisations. Researchers are both influenced and confined by the types of data collected and the way the data is visualised – one result of this can be seen in the large proportion of prompts which were associated with movement, as this was the most immediately visible aspect of the data. If the visualisation system developed further, more types of data would become at-hand, and able to shape the practices of the researchers. Similarly, the live view of the data was dependant on the speakers being connected to the participant’s WiFi. Due to these infrastructural concerns, attention and hence insight was focussed on indoor interactions, with insight about the use of the speakers outdoors limited to information the participants were willing and able to share without the interactions being grounded in the data.
The speakers and dashboard act as independent facilitators in the creation of knowledge, despite their agency being limited to responding to manipulation by the participants. The participants had control over the use of the speakers, the amount of information they were willing to share, the types of data they sent (e.g. photos, video, text), and the times they wished to respond. However, as the study progressed they also became more strategic about when and how they used the speakers themselves in order to affect when they received a prompt. These behavioural developments indicate that the participants understand and appreciate their power to regulate the pace of disruption within the research process. We argue that giving over agency to the participants about the interpretation and collection of data, beyond simply giving them the ability to stop taking part altogether and withdraw the data that is being collected on them, may help participants feel in control. We also saw the participants and researcher having a greater ability to actively engage and question each other throughout the study, where the speakers became objects that could be used conventionally to play music, but also be fixed, hacked, labelled, drawn on, and physically manipulated.
This distribution of agency between the actors involved in the research process counters the negative narrative discussed by Zuboff (2015). In contrast to thing ethnography and ethno-mining, the participants had greater control over the interpretation of the data by the researcher as the study progressed, rather than providing a retrospective reflection on the meaning of data. While ethnobot and contingent ESM do facilitate a similar level of live reflection, the research process presented here, allowed for more fluid two-way interaction, which led to the development of behaviours unrecorded by the other methods, specifically researcher-supported troubleshooting.
Looking towards the future use of this method, we feel that computational algorithms, which look for indicators within the data, such as threshold detection or activity recognition, might help initiate interactions with participants. Such a development would be necessary for the scaling up of the method as discussed in the following section. These interactions can take the form of traditional ESM style questions tailored to the trigger observed within the data, or even through a chatbot-interface. This would reduce the burden on the lead researcher who might choose to monitor the live data stream only at key times and with a pre-defined research question in mind. Conversely, it would increase the agency of the data collection and visualisation system, affecting the ability of both the researcher and participant to take part in active sense-making around the data. This opens the question of how ethnographers and other researchers mediate between algorithmic triggers or analyses and personal interactions with participants.
Developing the method and scaling up
Having shown that this method is capable of collecting rich data, would it be possible to carry out studies that are several orders of magnitude larger, and what would be involved in doing so? The study has been set up somewhat as a wizard-of-Oz version of a fully automated potential experiment. As such, the researcher’s task can be broken into three separate components: deciding when to initiate a dialogue, carrying out the dialogue, and interpreting the results. We discuss how this method could be scaled up and how it may be used within an industrial context by identifying the sites where collaboration with algorithms is useful, and the configurations that best combine human and machine intelligence. It is important to emphasise that we see this method as an ever-evolving and iterative process, where a researcher would take an active role in personal communication at key times, but who would also be able to set contingent experience sampling triggers throughout the process as they try to understand the behaviour of participants. As such the role of the ethnographer cannot be replaced by algorithms that trigger interactions, instead they would be actively engaged in calibrating and defining their function.
Within this study, the researcher started conversations in response to most observed activities. This was found by some participants to be intrusive, and shaped the behaviours of others (in Reflections on participation). A machine learning approach could use a combination of activity recognition (Bao and Intille 2004; Tapia, Intille and Larson 2004) and novelty detection (Markou and Singh 2003) to discount commonplace occurrences and manage the frequency of interactions to make best use of the attention of both researchers and participants. This would also have a positive effect for the time needed to monitor the data dashboard. The participants usually used their speakers once a day at key times, such as when getting ready or doing chores, the rest of the time the dashboard did not indicate any activity. Even basic automation such as alerts when there is a change in the data would increase the ratio of interesting interactions and decrease the need for continuous monitoring of the data, making it more plausible to carry out long term, large scale studies.
Making sense of the data is another area where machine learning could quickly support human activity. Raw sensor data is messy and multidimensional, and much of the analysis of habits here was carried out post-hoc. An ability to classify behaviours would direct human attention to a small set of truly interesting moments, focusing sensemaking efforts on the richest resources. These new behaviours could then be more painstakingly contextualised, and their data signatures added to models of activity to spot larger scale patterns.
Conducting the dialogue is somewhat more challenging. While the Ethnobot study (Tallyn et al. 2018) paves the way for new research practices, it remains to be seen how complex a dialogue system is necessary to reproduce a reasonable level of contextual inquiry. The current study tended towards relatively simple interactions – a well-chosen question and one or two follow up responses in most cases.
There is a question about generalisability. To test our developing method, we worked with Bluetooth speakers as objects that appeared in everyday social situations, with a good likelihood of being used in multiple locations and which were easy to make part of daily life. We were also bound by needing a device that would be regularly recharged and could house a battery and microprocessor. While there are many other devices that fit this criterion, application to different areas will still require some thought and customisation, both to the method and the devices.
Sensorizing objects and conducting research around them is costly in terms of resources and time. As technologies develop, however, we envision that this method could be used by design researchers and industrial product designers in contexts where many existing devices become potential research products (Odom et al. 2016). We believe the method would be appropriate alongside products that are perceived to have high value, have complex functionality, or where the data collection process is interlinked with the function of the device, such as autonomous vehicles, electric scooters, home assistants, smart meters, etc. Research around these devices would create additional complexity in terms of visually representing incoming data for a multitude of sensors across potentially vast numbers of devices, and in terms of the platform and methods used to communicate with users. Questions still remain about the content, data visualisations and capabilities that should be supported by an ethnographic dashboard. There is an opportunity to investigate best practices for data visualisation and participant-researcher communication in a collaborative co-design process accounting for the various stakeholders involved in industrial design research, including end users, designers, researchers, and manufacturers.
When adapting the method to be used by industry ethical and transparent data gathering practices are essential. A striking example of the extra precautions that would need to be in place when utilising a similar approach around industrial IoT products has been the public outcry against Amazon using human transcribers to verify language transcription for Alexa (Day, Turner and Drozdiak 2019). While the practice of human transcribers to help improve voice recognition tools is understandable in itself and is similar to the methodological proposition that we make with this paper, i.e. use data gathering around a smart product in order to generate design insight, we would like to outline several differences in our approach. The key differences are that taking part in our study required a strictly opt in form of consent, we viewed the gathering of audio/video and location data as too personal and thus avoided it, and there was no outsourcing of data analysis from the data collected by the speakers. While we see potential for our method to be used within industry we hope that great consideration would be given to issues around informed consent, opt-in data gathering, and non-personally identifiable sources of data.
We argue that by investigating contexts of use, we can build up an understanding of the behaviours, motivations and issues around a product, which can inform product design and development. This can be achieved by using machine learning and chat-bots to support real-time communication and make the best use of limited time and attention. Beyond discovering design opportunities this method has the potential to open up a dialogue between manufacturers, consumers, and ethnographers about the future of smart technology in terms of development, data collection, privacy and security. Making data-streams visible and accessible to users, even when facilitated through a researcher, can shift power dynamics around data capture. This dialogue and engagement around data can further the practice of “domestication of data, in which we, alongside the people we study, are participants” (Nafus, 2016).
CONCLUSION
The method that we propose within this paper builds upon work developed by the EPIC community. It reviews recent developments within contingent ESM, ethno-mining, thing ethnography and Ethnobot, where ethnographers utilise technology as a means for data collection in the wild. Our work identifies an opportunity for researchers to carry out real-time collaborative sensemaking by visualising live data streams, responding to activity they observe and communicating with participants near the time of activity.
We further contribute a study that tests the method, illustrating how it enables contextual inquiry, ground truthing of data, real-time problem solving, and allows participants to take on a collaborative role in research. We have shown that this method captures both obvious and subtle design insights, and can help enlist participants into active roles around the redesign of products. By avoiding on-device cameras and microphones we have decreased some of the ethical ramifications of background data capture. Finally, we have examined the technical issues around scaling the method up, and argued that there is an opportunity of utilising computational techniques in order to work more effectively with large populations and within industrial contexts.
ACKNOWLEDGMENTS
We would like to thank the participants who volunteered their time to make this research possible. We would also like to thank EPSRC who funded this research under the New Industrial Systems theme through the Chatty Factories project (EP/R021031/1).
REFERENCES
Aipperspach, Ryan, Ken Anderson, Paul Aoki, John F. Canny, Tye Lawrence Rattenbury, Allison Woodruff. 2006. “Ethno-Mining: Integrating Numbers and Words from the Ground Up.” Electrical Engineering and Computer Sciences University of California at Berkeley Tech Report. Accessed August 3, 2019. http://digitalassets.lib.berkeley.edu/techreports/ucb/text/EECS-2006-125.pdf
Anderson, Ken, Dawn Nafus, Tye Rattenbury, and Ryan Aipperspach. 2009. “Numbers have qualities too: experiences with ethno-mining.” Ethnographic Praxis in Industry Conference Proceedings:123–140. https://www.epicpeople.org/numbers-have-qualities-too-experiences-with-ethno-mining/
Bao, Ling, and Stephen S. Intille. 2004. “Activity recognition from user-annotated acceleration data.” International Conference on Pervasive Computing: 1- 17. Accessed August 3, 2019. doi:10.1007/978-3-540-24646-6_1
Berkel, Niels van, Denzil Ferreira, and Vassilis Kostakos. 2017. “The Experience Sampling Method on Mobile Devices.” ACM Comput. Surv. 50(6) Article 93. doi:10.1145/3123988
Bhavnani, Yash, Kerry Rodden, Laura Cuozzo Guarnotta, Margaret T. Lynn, Sara Chizari, and Laura Granka. 2017. “Understanding mobile phone activities via retrospective review of visualizations of usage data.” Proceedings of the 19th International Conference on Human-Computer Interaction with Mobile Devices and Services (MobileHCI ‘17): 58. doi:10.1145/3098279.3119841
Bogost, Ian. 2012. “Alien phenomenology, or, what it’s like to be a thing.” University Of Minnesota Press.
Braun, Virginia, and Victoria Clarke. 2006. “Using thematic analysis in psychology.” Qualitative Research in Psychology 3(2): 77–101. doi:10.1191/1478088706qp063oa
Brown, Barry, Abigail J. Sellen, and Kenton P. O’Hara. 2000. “A diary study of information capture in working life.” Proceedings of the SIGCHI conference on Human Factors in Computing Systems (CHI ‘00): 438-445. doi:10.1145/332040.332472
Burnett, Dan, James Thorp, Daniel Richards, Katerina Gorkovenko, and Dave Murray-Rust. 2019. “Digital Twins As a Resource for Design Research.” Proceedings of the 8th ACM International Symposium on Pervasive Displays (PerDis ’19): 37(2). doi:10.1145/3321335.3329685
Canzian, Luca, and Mirco Musolesi. 2015. “Trajectories of depression: unobtrusive monitoring of depressive states by means of smartphone mobility traces analysis.” Proceedings of the 2015 ACM International Joint Conference on Pervasive and Ubiquitous Computing (UbiComp ‘15): 1293-1304. doi:10.1145/2750858.2805845
Ceschin, Fabrizio, Idil Gaziulusoy. 2016. “Evolution of design for sustainability: From product design to design for system innovations and transitions.” Design Studies 47: 118-163. doi:10.1016/j.destud.2016.09.002
Chang, Wen-Wei, Elisa Giaccardi, Lin-Lin Chen, and Rung-Huei Liang. 2017. ““Interview with Things”: A First-thing Perspective to Understand the Scooter’s Everyday Socio-material Network in Taiwan.” Proceedings of the 2017 Conference on Designing Interactive Systems (DIS ‘17): 1001-1012. doi:10.1145/3064663.3064717
Churchill, Elizabeth. 2017. “Data, design, and ethnography.” Interactions 25 (1): 22- 23. doi:10.1145/3172893
Crabtree, Andy, Alan Chamberlain, Rebecca E. Grinter, Matt Jones, Tom Rodden, and Yvonne Rogers. 2013. “Introduction to the Special Issue of “The Turn to The Wild”.” ACM Transactions on Computer-Human Interactions 20 (3): 13. doi:10.1145/2491500.2491501
Crabtree, Andy, Tom Lodge, James Colley, Chris Greenhalgh, Kevin Glover, Hamed Haddadi, Yousef Amar, Richard Mortier, Qi Li, John Moore, Liang Wang, Poonam Yadav, Jianxin Zhao, Anthony Brown, Lachlan Urquhart, and Derek McAuley. 2018. “Building accountability into the Internet of Things: the IoT Databox model.” Journal of Reliable Intelligent Environments 4 (1): 39–55. doi:10.1007/s40860- 018- 0054- 5
Csikszentmihalyi, Mihaly, Kevin Rathunde, and Samuel Whalen. 1993. “Talented Teenagers: The Roots of Success and Failure”. New York: Cambridge University Press.
Day, Matt, Giles Turner and Natalia Drozdiak. 2019. “Thousands of Amazon Workers Listen to Alexa Users’ Conversations” Time. Accessed August 28, 2019. https://time.com/5568815/amazon-workers-listen-to-alexa/
Ellerbrok, Ariane. 2010. “Empowerment: Analysing Technologies of Multiple Variable Visibility.” Surveillance & Society 8 (2): 200-220.
Evans, Bob. 2016. “Paco—Applying Computational Methods to Scale Qualitative Methods.” Ethnographic Praxis in Industry Conference Proceedings: 348-368. https://www.epicpeople.org/applying-computational-methods/
Freeman, Linton, A. Kimball Romney and Sue C. Freeman. 1987. “Cognitive structure and informant accuracy.” American Anthropologist: 89(2): 310-325.
Gennip, Domenique van, Elise van den Hoven, and Panos Markopoulos. 2015. “Things That Make Us Reminisce: Everyday Memory Cues as Opportunities for Interaction Design.” Proceedings of the 33rd Annual ACM Conference on Human Factors in Computing Systems (CHI ‘15): 3443-3452. doi:10.1145/2702123.2702460
Giaccardi, Elisa, Nazli Cila, Chris Speed, and Melissa Caldwell. 2016. “Thing Ethnography: Doing Design Research with Non-Humans.” Proceedings of the 2016 ACM Conference on Designing Interactive Systems (DIS ‘16): 377-387. doi:10.1145/2901790.2901905
Giaccardi, Elisa, Chris Speed, Nazli Cila, and Melissa Caldwell. 2016. “Things as Co-ethnographers: Implications of a Thing Perspective for Design and Anthropology.” Design Anthropology Futures.
Gouveia, Ru?ben, and Evangelos Karapanos. 2013. “Footprint tracker: supporting diary studies with lifelogging.” Proceedings of the SIGCHI Conference on Human Factors in Computing Systems (CHI ‘13): 2921-2930. doi:10.1145/2470654.2481405
Gorkovenko, Katerina, Nick Taylor, and Jon Rogers. 2017. “Social Printers: A Physical Social Network for Political Debates.” Proceedings of the 2017 CHI Conference on Human Factors in Computing Systems (CHI ‘17): 2269-2281. doi:10.1145/3025453.3025611
Haines, Julia K.,. 2017. “Towards Multi-Dimensional Ethnography.” Ethnographic Praxis in Industry Conference Proceedings: 127-157. https://www.epicpeople.org/towards-multi-dimensional-ethnography/
Harman, Graham. 2011. “Tool-being: Heidegger and the metaphysics of objects.” Open Court.
Harman, Graham. 2012. “The Well-Wrought Broken Hammer: Object-Oriented Literary Criticism.” New Literary History 43: 183–203. doi:10.2307/23259371
Harman, Graham. 2016. “Immaterialism: Objects and Social Theory.” Cambridge: Polity Press.
Hoven, Elise van den. 2015. “From Materialising to Memories: Design research to support personal remembering.” Proceedings of the 15th New Zealand Conference on Human-Computer Interaction (CHINZ 2015): 83-83. doi:10.1145/2808047.2817759
Hutchinson, Hilary, Wendy Mackay, Bo Westerlund, Benjamin B. Bederson, Allison Druin, Catherine Plaisant, Michel Beaudouin-Lafon, Ste?phane Conversy, Helen Evans, Heiko Hansen, Nicolas Roussel and Bjo?rn Eiderba?ck. 2003. “Technology probes: inspiring design for and with families.” Proceedings of the SIGCHI Conference on Human Factors in Computing Systems (CHI ’03): 17–24. doi:10.1145/642611.642616
Kennedy, Helen, Thomas Poell and Jose van Dijck. 2015. “Data and agency.” Big Data & Society. doi:10.1177/2053951715621569.
Makinen, Liisa. 2016. “Surveillance ON/OFF. Examining home surveillance systems from the user’s perspective.” Surveillance and Society 14 (1): 59-77. doi:10.24908/ss.v14i1.5488
Markou, Markos, and Sameer Singh. 2003. “Novelty detection: a review—part 1: statistical approaches.” Signal processing 83 (12): 2481-2497. doi:10.1016/j.sigpro.2003.07.018
Matejka, Justin, Michael Glueck, Erin Bradner, Ali Hashemi, Tovi Grossman, and George Fitzmaurice. 2018. “Dream Lens: Exploration and Visualization of Large-Scale Generative Design Datasets.” Proceedings of the 2018 CHI Conference on Human Factors in Computing Systems (CHI ‘18): 369. doi:10.1145/3173574.3173943
Mols, Ine, Elise van den Hoven, and Berry Eggen. 2016. “Informing Design for Reflection: an Overview of Current Everyday Practices.” Proceedings of the 9th Nordic Conference on Human-Computer Interaction (NordiCHI ‘16): 21. doi:10.1145/2971485.2971494
Montjoye, Yves-Alexandre de, Cesar A. Hidalgo, Michel Verleysen, and Vincent D. Blondel. 2013. “Unique in the crowd: The privacy bounds of human mobility.” Scientific reports 3: 1376. doi:10.1038/srep01376
Mortier, Richard, Hamed Haddadi, Tristan Henderson, Derek McAuley, and Jon Crowcroft. 2015. Human- Data Interaction: The Human Face of the Data-Driven Society. Accessed August 3, 2019. https://arxiv.org/abs/1412.6159
Muüller, Hendrik, Jennifer L. Gove, John S. Webb, and Aaron Cheang. 2015. “Understanding and Comparing Smartphone and Tablet Use: Insights from a LargeScale Diary Study.” Proceedings of the Annual Meeting of the Australian Special Interest Group for Computer Human Interaction (OzCHI’15): 427-436. doi:10.1145/2838739.2838748
Murray-Rust, Dave, Katerina Gorkovenko, Dan Burnett, Daniel Richards. 2019. “Entangled Ethnography: Towards a collective future understanding.” Proceedings of the Halfway to the Future Conference.
Nafus, Dawn. 2016. “The Domestication of Data: Why Embracing Digital Data Means Embracing Bigger Questions.” Ethnographic Praxis in Industry Conference Proceedings: 384-399.
Nissenbaum, Helen. 2004. “Privacy as contextual integrity.” Washington Law Review 79 (1).
O’Hara, Kenton, and Mark Perry. 2001. “Shopping anytime anywhere.” CHI ‘01 Extended Abstracts on Human Factors in Computing Systems (CHI EA ‘01): 345-346. doi:10.1145/634067.634271
Odom, William, Ron Wakkary, Youn-kyung Lim, Audrey Desjardins, Bart Hengeveld, and Richard Banks. 2016. “From Research Prototype to Research Product.” Proceedings of the 2016 CHI Conference on Human Factors in Computing Systems (CHI ‘16): 2549-2561. doi:10.1145/2858036.2858447
Orton-Johnson, Kate, and Nick Prior. 2013. “Digital sociology: Critical perspectives.” Springer.
Oulasvirta, Antti, Aurora Pihlajamaa, Jukka Perkiö, Debarshi Ray, Taneli Vähäkangas, Tero Hasu, Niklas Vainio, and Petri Myllymäki. 2012. Long-term effects of ubiquitous surveillance in the home. Proceedings of the 2012 ACM Conference on Ubiquitous Computing (UbiComp ‘12): 41-50. doi:10.1145/2370216.2370224
Rader, Emilee. 2014. “Awareness of Behavioral Tracking and Information Privacy Concern in Facebook and Google.” SOUPS 14: 51-67.
Salvador, Tony, Genevieve Bell, and Ken Anderson. 1999. “Design Ethnography.” Design Management Journal 10 (4).
Silfverberg, Suvi, Lassi A. Liikkanen, and Airi Lampinen. 2011. ““I’ll press play, but I won’t listen”:profile work in a music-focused social network service.” Proceedings of the ACM 2011 conference on Computer supported cooperative work (CSCW ‘11): 207-216. doi:10.1145/1958824.1958855
Skatova, Anya, Victoria E. Shipp, Lee Spacagna, Benjamin Bedwell, Ahmad Beltagui, and Tom Rodden. 2015. “Datawear: Self-reflection on the Go or How to Ethically Use Wearable Cameras for Research.” Proceedings of the 33rd Annual ACM Conference Extended Abstracts on Human Factors in Computing Systems (CHI EA ‘15): 323-326. doi:10.1145/2702613.2725450
Smets, Annelien, and Bram Lievens. 2018. “Human Sensemaking in the Smart City : A Research Approach Merging Big and Thick Data.” Ethnographic Praxis in Industry Conference Proceedings: 179-194. https://arxiv.org/abs/1412.6159
Tapia, Emmanuel, Stephen S. Intille, and Kent Larson. 2004. “Activity recognition in the home using simple and ubiquitous sensors.” International conference on pervasive computing: 158-175. doi:10.1007/978-3-540-24646-6_10
Tallyn, Ella, Hector Fried, Rory Gianni, Amy Isard, and Chris Speed. 2018. “The Ethnobot: Gathering Ethnographies in the Age of IoT.” Proceedings of the 2018 CHI Conference on Human Factors in Computing Systems (CHI ‘18): 604-617. doi:10.1145/3173574.3174178
Thatcher, Jim, David O’Sullivan and Dillon Mahmoudi. 2015. “Data Colonialism Through Accumulation by Dispossession: New Metaphors for Daily Data.” Environment and Planning D, In Society and Space 34 (6): 990-100.
Tsai, Wenn-Chieh, Po-Hao Wang, Hung-Chi Lee, Rung-Huei Liang, and Jane Hsu. 2014. “The reflexive printer: toward making sense of perceived drawbacks in technology-mediated reminiscence.” Proceedings of the 2014 conference on Designing interactive systems (DIS ‘14): 995-1004. doi:10.1145/2598510.259858
Zhang, Shaozeng, Bo Zhao, and Jennifer Ventrella. 2018. “Towards an Archaeological-Ethnographic Approach to Big Data: Rethinking Data Veracity.” Ethnographic Praxis in Industry Conference Proceedings (EPIC’18): 61-85. https://www.epicpeople.org/archaeological-ethnographic-big-data/
Zuboff, Shoshana. 2015. “Big Other: Surveillance Capitalism and the Prospects of an Information Civilization.” Journal of Information Technology 30: 75–89. doi:10.1057/jit.2015.5