
Challenging measures of scale is possible through listening to stories of how people value a product, and envisioning ways to measure success beyond typical metrics like Monthly Active Use (MAU) or Daily Active Use (DAU).
Understanding what people value is somewhat complex for a product like Firefox because people might use Firefox every day without thinking much about it. In this case study, we detail how we used Futures Thinking and participatory design methods to elicit stories of how people value Firefox.
This case study demonstrates that a relatively small number of meaningful ethnographic insights can be powerful enough to influence business strategy. By creating the space for listening to stories and encouraging stakeholder involvement, we were able to make the case to save one of our mobile browsers, Firefox Focus, despite its lack of scale.
Keywords: Diary Study, Firefox, Futures Thinking, Interviews, Mozilla, Participatory Design, Remote Research, Stakeholder Interviews, Workflow, Workshop
CONTEXT
Over 200 million people use the Firefox web browser every month (Mozilla 2020a). While this works out to less than 10% market share (Statcounter 2020), Firefox has arguably achieved classic definitions of scale. However, the number of people who use Firefox each month has been decreasing over time (Mozilla 2020a) and many efforts at Mozilla, the company behind the Firefox browser, have sought to understand and stop this decline. Measuring success through how a product scales is commonplace. Scale is often assessed through things like Monthly Active Use (MAU) and Daily Active Use (DAU), and entire communities exist to simply increase the growth curve of those numbers (GrowthHackers 2020). We respect the need to measure Mozilla’s impact and scale through the sheer number of people who use the Firefox browser, yet as ethnographers, we also know that the reasons behind product choice and usage are often more complex than numbers alone can illustrate.
This case study will discuss a research effort aimed at getting to the heart of a fundamental question: How do people describe the value they get out of Firefox? We hypothesized that by better understanding how people describe the value they get out of Firefox, we would be able to better inform how to measure our success as a company and encourage our leaders to complement traditional measures of scale with more human-centered metrics. This question may strike readers as almost too fundamental. After all, shouldn’t product value be well understood after being in the market for over 20 years? But commonplace products like a web browser present unique challenges for ethnographers. The role of a web browser is almost akin to a utility–it is deeply domesticated (Haddon 2005) into people’s lives. People may use Firefox every day without thinking much about it.
Another unique challenge for Mozilla is that the usage data to understand how people use Firefox is often nonexistent. Mozilla practices very limited data collection Our data practices are aligned with our mission1 and we do not collect information about the content people visit on the web, or spend our resources building usage profiles to sell to advertisers (Mozilla 2020b, Mozilla 2020c, Mozilla 2020d). Often, user research is the only opportunity our organization has to understand the content people seek out and their workflows within the browser. For these reasons, we knew we needed to ground our research approach in methods that would help us dig deep and really get at the root of how people value Firefox.
The genesis of this project came out of two related, but distinct efforts. The first effort was led by our Data Science team and sought to review our current in-product metrics in order to better understand how to interpret our usage numbers and expose any gaps. Our User Research team consulted on that project and followed along with the results. That project exposed a gap in our metrics understanding, where there was limited qualitative explanation of usage numbers that were grounded in ethnographic research.
The second effort, led by a cross-functional research team, aimed to gain a top-down view of value by asking our senior leaders how they would define the value of our products. Perhaps unsurprisingly, we found that not every leader had the same answer. There was a lack of alignment around who our products’ primary audience is and how we address people’s needs in our products.
The authors were each involved in one of these projects, and as often happens with foundational, ethnographic work, we proposed a study that was not previously on our roadmap by identifying an opportunity to align these efforts and explore the gaps we were observing. We hypothesized that better understanding the nuanced ways that people talk about the value they derive from using our products could help us define new, human-centered metrics to measure our success and scale against. We knew it was time to get an “outside in” perspective to help better inform our internal narrative, and ultimately help our organization make better product decisions.
METHOD
To overcome the challenges around investigating value in a domesticated, routine product we knew we would need to develop a mixed method approach that included interactive activities, and not rely solely on something like a retrospective interview.
The research proposal was completed in August 2019, and the research itself was conducted in late September & October 2019 for Desktop and February 2020 for Mobile. The last report out related to the research was in April 2020.
Research Activities
The research included three phases: a diary study, remote interviews, and an in-person workshop.
The diary study took place over three consecutive days where participants reflected on their use of Firefox each day. We aimed to get a foundational understanding of how these particular participants use Firefox. Additionally, we wanted to get participants in the mindset of actually thinking about Firefox and how they value it. To get people in this mindset of thinking about Firefox, participants responded to a pessimistic scenario, inspired by Futures Thinking (Textor 1980), asking how their day would be impacted (or not) if Firefox wasn’t available that day.
We used the remote interviews to begin to build rapport with individual participants before the workshop and to learn about participants’ history with Firefox. Responses from the diary study were also clarified during the remote interviews.
The third, and main part, of the study was a two and a half hour in-person workshop (Table 1). Each workshop involved five to six participants, and two to four Mozilla employees. The workshop relied on both the remote interviews and diary study to gain a basic understanding of participants and their use of Firefox before diving deeper.
Table 1. Workshop Agenda.
| Length (minutes) | Activity |
| 10 | Settle in. Get name tag, write pronoun on it. |
| 5 | Quick introductions. Why we’re here today, introducing workshop leads. |
| 25 | Warm up. Longer introductions. |
| 20 | Optimistic scenario building. |
| 20 | Pessimistic scenario building. |
| 10 | Break. |
| 30 | Metric scenario building. |
| 10 | Value prop evaluation. |
| 15 | How Firefox should measure success. Pitch videos. |
| 5 | Wrap up. |
An interactive workshop that included a range of activities
The workshop was grounded in Futures Thinking (Textor 1980), where we elicited optimistic, pessimistic, and “normal” scenarios from participants (Figure 1). As mentioned earlier, someone could use Firefox without really thinking about it. So, Futures Thinking was particularly appropriate in this case, to enable participants to think deeply about how Firefox is valuable to them. The workshop resulted in many, varied real and imagined scenarios that included not only how they value Firefox, but also how they feel about that value.
![Title of worksheet is “Imagine that everything works perfect for a day while you're using your Firefox mobile browser.” Contains additional prompts: “What happened on a day like this?” “I feel [blank] because Firefox is working perfectly.” “Does Firefox working well have an impact on your day? Circle one: Yes, No, I don't know. Explain your response:”. Space provided to draw things.](https://www.epicpeople.org/wp-content/uploads/2023/06/01-1.png)
Figure 1. Optimistic Scenario Building Worksheet. Positive retrospective worksheet to elicit conversations about how people value Firefox.
Given the gaps we observed while working with our Data Science team around a lack of qualitative understanding of our usage metrics, we used these workshop exercises to reflect on the stories behind Firefox usage. For example, we asked participants to describe a time when they searched more in Firefox, to qualitatively understand a metric of “amount of searches” (Figure 2).
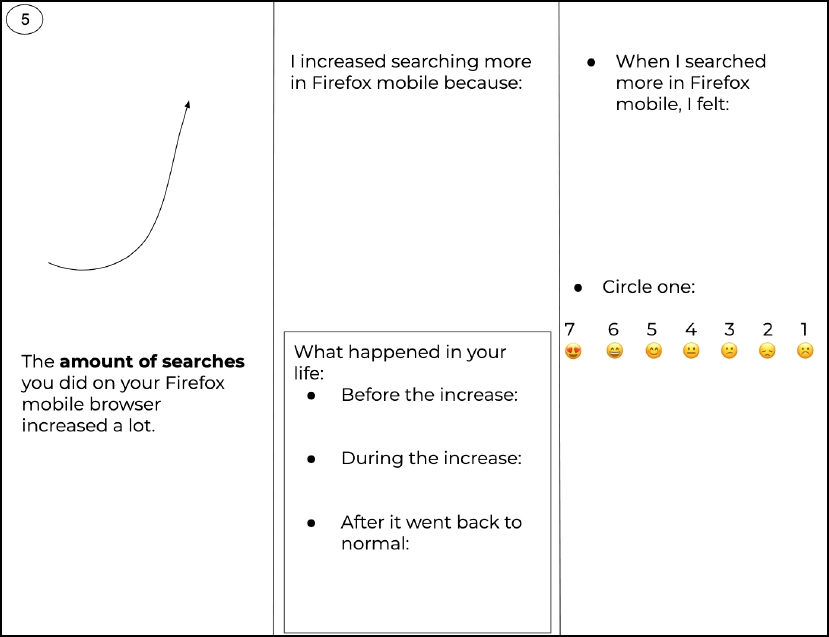
Figure 2. Amount of Searches Worksheet. Retrospective worksheet to elicit conversation about what stories might be behind our metric of “amount of searches”.
At the end of the workshop, inspired by participatory design methods (Stephen 2012), we “showed our cards”, and asked participants to create a pitch video about how they thought Mozilla leaders should measure the value people get out of Firefox. Each participant was video recorded giving a short (1 minute or less) fictional pitch to Mozilla leadership. The participatory method of the pitch video provided our team with new ideas. For example, a participant in Berlin focused on a theme of security, and whether or not people understand security, privacy, and what data is collected from Firefox:
“I would base my assumptions on usage figures, i.e. usage period, age. I’d also argue that Mozilla is limited to the most important features and remains minimalistic and clear – especially on the phone. It would also be important that security is well understood by users – especially younger folks. It should be easy to understand security settings and stay informed about which data is collected.” – Participant in Berlin
While our organization tracks security bugs, and reduces errors as much as possible with each Firefox release, we do not use security and its understanding as a top-level success metric for our products. Measures related to privacy and security would be wholly aligned with our mission1, and we are grateful to the participant for their ideas.
Location
Our research took place in six locations: Berlin, Chicago, Portland (Oregon), Seattle, Taipei, and Vancouver (Canada). The locations were decided using a variety of factors, including 1) where Firefox market share is, 2) where stakeholders are located, 3) where researchers are located, and 4) where we have not done ethnographic research in the recent past. For 2), note that stakeholders are distributed around the globe as Mozilla has many remote workers.
All research materials and activities were conducted in English for locations in North America, in German for Berlin, and in Chinese for Taipei. In Berlin, there was a simultaneous interpreter present for the remote interviews and workshops to translate to and from English and German, as many people in Berlin communicate in English. Research notes, diary entries, and pitch videos were translated back into English for analysis.
Participants
In total, there were 61 participants across all the locations. The participants remained the same during each of three phases, to help us get a deeper understanding of how they value Firefox. To explain, we ran two workshops in Vancouver, and there were five to six participants in each workshop. Those same five to six participants also took part in the diary study and remote interview.
Participants were recruited using a professional recruiting agency and through an in-product invitation. In-product recruiting for in-person research was relatively novel at Mozilla, so only a handful of participants were recruited that way, to test the capability. It’s outside of the scope of this case study, so suffice to say, in-product recruiting worked.
All participants were required to have and use Firefox on either a desktop computer, a mobile device, or both. Participants were all 19 years or older, and spoke either conversational English, German, or Chinese, depending on where they were located. As Firefox is used by a range of individuals, we aimed to get a diverse representation of people, on the following axes: self-reported weekly hours of using Firefox, operating systems, job status, industry (if applicable), gender, age, early adopter status, educational background, income, race/ethnicity/tribe. Race/ethnicity/tribe were only asked in the US and Canada due to regulations.
These methods are explained for other researchers to have insight into how they might replicate an interactive discussion with people who use their products to learn how they value those products, and how they would suggest the business measure success.
INSIGHTS ABOUT OUR PROCESS
Stakeholder Involvement
Our six workshops were run globally. We leveraged facilitation skills from designers and researchers across Mozilla, even outside of our team. This was a large investment to ask of our organization, so we knew successfully launching this study would require buy-in from a wide variety of stakeholders. Because of this, we spent more time in the research proposal phase than usual (over a month), soliciting feedback and incorporating changes into our proposal. Our recommendation to other ethnographers is: Do not underestimate the proposal phase. Even though we had the budget on our team to do the work, we knew we needed people to not only see this work, but see it as a priority and something worthy of their attention. The proposal included what the organization could gain from the work. For example, we argued that this work could provide empirical grounding for current and future metrics.
Mozilla stakeholders appreciate and request research, oftentimes more than what our small team can handle. Barriers for stakeholder participation were not related to valuing research in general, but rather more practical barriers like prioritizing participating in this research project compared to other day-to-day work. So, we worked diligently to get stakeholders involved in a hands-on way with the research activities. Instead of sending out a general call for note-takers and observers, we reached out to specific individuals that we wanted to encourage to participate. We explained why we thought they might be interested, and why we wanted them to experience this work first-hand. In some cases, we even chose locations that were close to our most senior stakeholders in order to increase the likelihood of their participation, since we knew that limiting long distance travel would enable more of them to join our field team.
Additionally, we set up a half-day after each workshop to dig into analysis with stakeholders. We set up detailed spreadsheets ahead of time to make coordinated analysis possible with multiple locations conducting this work simultaneously (Figure 3). The spreadsheets allowed for multiple field teams to enter data at the same time in a structured way, which greatly simplified our more formal analysis work later on. Finally, after we created a draft report, we piloted our talk with just our stakeholders to get their thoughts and feedback before sharing it with a larger audience. We’ve found that giving stakeholders a preview often means that they feel more confident contributing to the discussion during larger share outs.
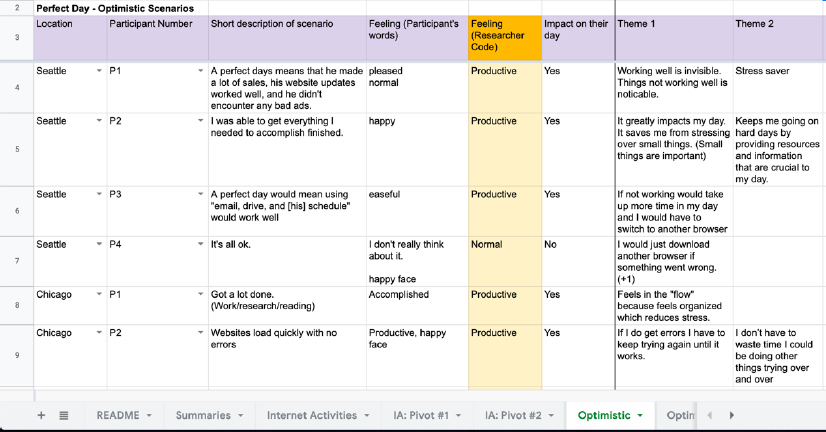
Figure 3. Group Analysis Spreadsheet. A section of our group analysis spreadsheet showing how we managed data from multiple locations simultaneously.
Who were our stakeholders? We focused our stakeholder recruitment mostly on Program Managers and Program Directors. We also had strong support from Data Science, who helped us thoughtfully consider the potential impact of the measurements our participants proposed (i.e. Could we measure what was suggested? How would we measure it?). We were excited to include a few new hires as field team members (some in Data Science, some in Program Management), since we believe that the experience of a user research study, and hearing directly from people using our products, is an excellent way to onboard new colleagues.
INSIGHTS FROM PARTICIPANTS
This research helped us better understand the value of our products by focusing on stories behind people’s needs and the workflows people use to accomplish their goals. We learned that the top-of-mind most valuable activities that participants use Firefox for are:
Table 2. Valuable Use Cases in Firefox Desktop and Mobile.
Firefox Desktop
|
Firefox Mobile
|
Participants shared their most valuable ways they use Firefox, and they fell into the categories above.
Using our Futures Thinking exercises, where we elicited optimistic, pessimistic, and “normal” scenarios from participants (Figure 1), we learned that when Firefox works well, participants feel “productive”, “happy”, “efficient”, “in the flow”, and “normal.” Imagining when Firefox doesn’t work well (like losing all their saved history, passwords, and bookmarks), participants felt “indifferent, “angry”, and “stressed.”
We also learned how participants felt in scenarios that were related directly to our metrics (Figure 2). It showed us something we, as ethnographers, often feel–that positive “hockey-stick” style growth or usage, is not always a “good thing” for someone using a product. For example, one participant in Vancouver, Canada described preparing for a race in Whistler, Canada called the Donut Dash. He described researching the race rules, FAQs, the registration fee, the registration form, and the race course. All of these details were open in different tabs in his Firefox browser. He started his search excited to sign up for the race, but ended up feeling overwhelmed by the number of tabs he had open and how hard it was to keep track of all the different information he needed to understand. This participant described this experience of “information overload” as something that ultimately made him feel uninformed, unprepared, and unmotivated. The number of tabs correlates with a metric around intensity of use, which as a business is viewed positively and is valuable for revenue. However, for this participant, his story shows how having so many tabs open was overwhelming to him.
As we mentioned earlier, one of our goals was to introduce new human-centered metrics to how our organization measures success. Input from our participants resulted in specific recommendations including: A search satisfaction metric, and a metric to measure if people using Firefox are in the psychological state of “flow” (Wikipedia 2020).
RESEARCH IMPACT
Use Case Articulation
Earlier, we mentioned that this study was not just about what people do with Firefox, but how they value it. However, we were initially surprised that one of the stickiest results from this study was, in fact, what people do with Firefox. Upon reflection we understood that, because of our mission-driven commitment to limited data collection, our engineering-led organization tends to focus more on the mechanics of maintaining an open-source browser, rather than investigating what people might be using the browser for. Ultimately, it makes sense that our organization would latch on to this high-level overview of how people are using Firefox on desktop and mobile devices in the absence of comprehensive personal data collection.
This is a sample bullet list:
- first bullet
- second bullet
- third bullet
While this result told us what participants used Firefox for, it also showed us what kinds of internet activities were most important to them (Table 2). This data came from an introductory activity during the workshop where we asked people to write or draw at least one important thing they do on the internet. We followed this exercise with a discussion where participants explained their choices and built on what other participants were sharing. The researchers then coded all of these examples against a primary list of internet workflows that our team has developed over our years of research to categorize them into high-level themes.
This use case articulation ended up inspiring a variety of mixed method efforts in our organization. Other members of our research team, primarily Rosanne Scholl, used this information to design multiple surveys fielded across thousands of individuals to see how these categories “rate” at scale. The results of these surveys showed that these categories were highly durable and effectively described the high-level activities that people who use Firefox engage in with the browser.2 One interesting survey finding was that “education” emerged as a frequently cited additional important use case for desktop in our surveys, which coincided with the beginning of the COVID-19 pandemic and a massive cultural shift toward online learning. The results from this case study also inspired a design sprint on the topic of entertainment, a topic that Mozilla had not previously dedicated many resources to.
Saving Firefox Focus
This research effort was a large investment for our organization, but one that has been widely regarded as an important piece of foundational research for Firefox. We presented a large number of recommendations to various teams, and as often happens, the findings that ended up gaining traction were not necessarily tied to our original intent, but are no less important. We went into this research hoping to inspire our organization to describe and instrument new metrics to measure our products and their success. In fact, Data Science’s involvement in our research strengthened our recommendations related to human-centered metrics. But, in addition to the unexpected impact of our participant use case articulation, the biggest success coming out of this work is that we were able to save a decommissioned product: Firefox Focus.
Firefox Focus is a specialty mobile browser designed around privacy and simplicity. Focus automatically blocks a wide range of online trackers and makes it easy to erase history, passwords, and cookies with a single button, ensuring people won’t be followed by things like unwanted ads (Figure 4). Focus has a relatively small number of people who use it and does not have a measurable impact on Mozilla’s revenue. As a result, a decision was made in early 2019 to sunset Firefox Focus due to resource constraints in an effort to simplify our product portfolio. The sunset decision was reversed because of our research.
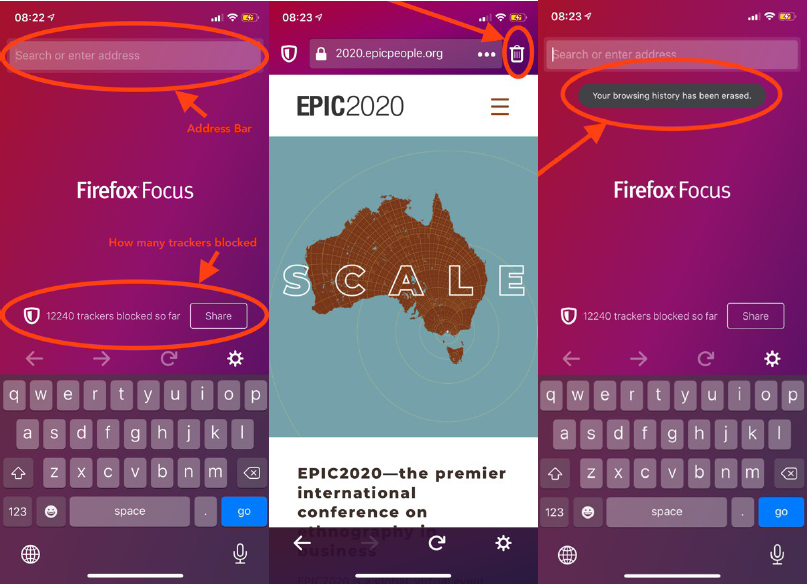
Figure 4. Firefox Focus. From left to right: 1) Firefox Focus Home Screen that shows an Address Bar and how many trackers have been blocked; 2) Firefox Focus when visiting a webpage, including the “trash” icon to the top right; 3) After selecting the “trash” icon, Firefox Focus shows that browsing history has been erased.
We were able to show through this study that despite its relatively small usage base, Focus is often used alongside another Firefox mobile browser and plays a critical role in some people’s workflows for specific use cases. For example, a preschool teacher in one of our Seattle workshops described themselves as a long-term user of Firefox. They use Firefox on both their desktop and their Android device, and they also said they use Focus for specific tasks. They do a lot of research on their mobile device related to their hobbies – things like gardening and vegan cooking. This participant is also quite politically active and they described how they switch to Focus for their political research because they, “Don’t always want things recorded” (Figure 5). We heard similar things from other participants who used Focus in our workshops. Focus was often present alongside another mobile browser and used for specific kinds of tasks–sometimes for content that was sensitive in nature, but other times for quick one-off searches because participants liked starting each session fresh and knew there was some information they didn’t need to retain.
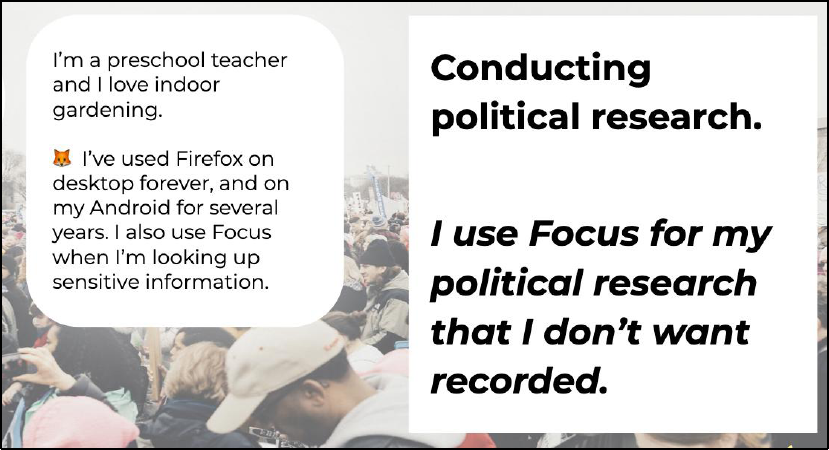
Figure 5. Using Firefox Focus. Excerpt from internal presentation to stakeholders.
After multiple report-outs of this research work, and digging through past Firefox Focus research primarily conducted by team member Alice Rhee, our mobile business strategy was changed to not only use the calculable metrics of daily active use or number of downloads, but to also include a deep consideration for the people who already use and love Focus. We attribute the change in decision in part to the fact that we had the support of two senior PMs in this product space who were part of our field team. These individuals were able to hear these stories from participants first-hand and debrief with our field team after our workshops. We were able to make the case to save this unique product in spite of its lack of scale, and ultimately alter our organization’s view on how we can define the success of our products. Our exact recommendation for Focus was:
“Bring focus back to Focus: Continue to support Focus. Participants that were using Focus were often using it alongside another browser for specific tasks and valued the simplicity of the experience. Can we get folks who use our Firefox mobile browser to also use Focus for their quick searches?”
The above recommendation did not refer to usage metrics, like “how many people use Firefox Focus compared to our flagship browser.” Instead, we explained how people value Firefox Focus. We believe this focus on value helped us influence the decision to keep Firefox Focus in our product suite.
After giving presentations all over the organization, including a lightning talk that inspired colleagues to create a particularly fun Zoom online meeting background (Figure 6), a decision was made to keep Focus around.
Figure 6. Save Firefox Focus. Zoom background used internally to promote strategy change.
CONCLUSION
This case study explains how our original intent was to re-define, or add to, our organization’s current ways of measuring success. However, by listening to individuals’ stories through methods inspired by Futures Thinking and participatory design, and involving our stakeholders during every step from planning to analysis, we had another outcome. Decision makers used the stories they witnessed first-hand about how participants deeply valued Firefox Focus to revive this decommissioned product. We urge other ethnographers to use their research to challenge, question, or complement typical measurements of scale, listen to the people who use your products, ask for their opinion on how to measure success, and as always, bring decision makers into the field with you.
Gemma Petrie is a Principal Researcher at Mozilla Firefox. She enjoys conducting research using a wide variety of methods, building and leading teams, and working to increase the value of research in organizations. Gemma has a BA in Philosophy from Reed College and an MLIS from the University of Illinois Urbana-Champaign.
Jennifer Davidson is a Staff Researcher at Okta, previously at Mozilla Firefox. Aside from being a mixed methods researcher in industry, she enjoys teaching at universities, non-profits, and vocational schools. Jennifer has a PhD in Computer Science, with an emphasis in Human-Computer Interaction from Oregon State University.
NOTES
Acknowledgements—Thank you to the many Mozillians who led this research with us. Thank you to Lisa Kleinman for the thoughtful review. The views represented here are not necessarily the views of our employers.
1. “Our mission is to ensure the Internet is a global public resource, open and accessible to all. An Internet that truly puts people first, where individuals can shape their own experience and are empowered, safe and independent.”
2. This is just an extra note to test the notes formatting.
REFERENCES CITED
GrowthHackers. 2020. GrowthHackers website. Accessed September 27, 2020. https://growthhackers.com/posts.
Haddon, Leslie. 2006. “The Contribution of Domestication Research to In-Home Computing and Media Consumption.” The Information Society: An International Journal 22 (4): 195–203. doi: 10.1080/01972240600791325.
Lindsay, Stephen, Daniel Jackson, Guy Schofield, and Patrick Oliver. 2012. “Engaging older people using participatory design.” In Proceedings of the SIGCHI conference on human factors in computing systems: 1199–1208. doi: 10.1145/2207676.2208570.
Mozilla. 2020a. “Firefox Public Data Report.” Mozilla website. Accessed September 27, 2020. https://data.firefox.com/dashboard/user-activity.
Mozilla. 2020b. “Lean Data Practices.” Mozilla website. Accessed September 27, 2020. https://www.mozilla.org/en-US/about/policy/lean-data/.
Mozilla. 2020c. “Mozilla Privacy Policy.” Mozilla website. Accessed September 27, 2020. https://www.mozilla.org/en-US/privacy/.
Mozilla. 2020d. “We’re Building a Better Internet.” Mozilla website. Accessed September 27, 2020. https://www.mozilla.org/en-US/mission/.
Statcounter. 2020. “Desktop Browser Market Share Worldwide.” Statcounter website. Accessed September 27, 2020. https://gs.statcounter.com/browser-market-share/desktop/worldwide.
Textor, Robert B. 1980. A handbook on ethnographic futures research. Stanford, CA: Stanford University Press.
Wikipedia. 2020. “Flow (psychology)”. Wikipedia website. Accessed September 27, 2020. https://en.wikipedia.org/wiki/Flow_(psychology).