
As algorithms play an increasingly important role in the lives of people and corporations, finding more effective, ethical, and empathetic ways of developing them has become an industry imperative. Ethnography, and the contextual understanding derived from it, has the potential to fundamentally change the way that data science is done. Reciprocally, engaging with data science can help ethnographers focus their efforts, build stronger and more precise insights, and ultimately have greater impact once their work is incorporated into the algorithms that increasingly power our society. In practice, building contextually-informed algorithms requires collaboration between human science and data science teams who are willing to extend their frame of reference beyond their core skill areas. This paper aims to first address the features of ethnography and data science that make collaboration between the two more valuable than the sum of their respective parts; second, to present a methodology that makes collaboration between the two possible in practical terms; and third, to generate critical discussion through an examination of the authors’ experiences leading and working within joint teams of ethnographers and data scientists.
INTRODUCTION
The term “Big Data” has gone out of fashion. Some posit that it collapsed under the weight of lofty expectations – access to massive datasets is not, as business leaders found out, a digital panacea.1 Others contend it was simply refashioned into less fetishizing terms like “data-driven”2 or replaced by references to its real-world applications like machine learning.3 Most agree, however, that big data – though no longer deserving of capitalization4 – lives on in the ever-increasing relevance of its mission: some 80% of any company’s data remains unstructured and unused, and businesses strive to make that information accessible to those with the necessary skills and tools to harness its value.5 Increasingly, this means looking beyond the traditional methods of data analysis.
Social scientists, too, have sought to shed new light on deep and dark data lakes by combining big data analytics with qualitative observation in the form of ethnographically-inflected “thick data.”6 In the proceedings of EPIC alone, discussion around collaboration between the social and data sciences has ranged from new opportunities for mixed methods research7, to exploring the lifecycle of a data source8, to understanding decision-making within data analytics processes.9 Moreover, as Kate Crawford describes in her 2017 Keynote to the Conference on Neural Information Processing Systems, data scientists themselves are now seeking input from people with a deep expertise in human issues.10 For example, in response to recent high-profile privacy scandals, companies like Facebook are advertising the need to look past trace data and towards “the contextual knowledge that computers lack.”11 Data and human scientists are well agreed on the opportunities of combining their respective methodologies. The question, then, is no longer whether we need to combine big and thick data – the question is how best to do it.12
The danger of ignoring this practical question – and simply presuming a commonsense relationship between data and human science – lies in the failure to consciously identify how these two methodologies might actually influence one another. As Nick Seaver writes, the big and thick data conversation fits within a long lineage of “neatly opposed methodological moieties.”13 In relation to methods of standardizing behavioral analysis – of which big data is far from the first – human scientists continue to rehearse established scripts about how “renewed attention to the blood and sex of daily life” might rescue or regulate formal analysis.14 Seaver argues for pushing beyond these familiar scripts to attend more carefully to how these specific methodologies might actually interact. With Seaver, in this paper we will explore how an understanding of social and data science processes might more meaningfully inform collaboration between the two. Consequently, we will attempt to give more “texture and specificity” to the practices of big data and interrogate the “coherence and self-evidence” of ethnography in the process.15
Over the last two years Cognizant – a leading technology services company with deep capabilities within Data Analytics and AI – and ReD Associates – a consulting firm that helped pioneer the use of applied ethnography – have developed a suite of offerings that leverage the best of both data and human science in the service of real client problems. We’ve had hundreds of conversations with Fortune 500 executives around potential services, but it has become clear that the one area where the integration of human and data science is most demanding – and potentially most impactful – is in the creation and refinement of algorithms. These algorithms increasingly make up the backbone of many businesses by automating their interactions with customers, employees, and stakeholders. Concerns about ethics and efficiency, however, have led these same businesses to seek new insights around their algorithms. In response, ReD and Cognizant developed a methodology called Contextual Analytics: a project process for uniting data analysts and social scientists under the mandate of building more effective and credible algorithms.
Simply putting data analysts and social scientists in a room together is not enough to ensure a better algorithm. Rather, our experiences point to the need to design projects in a fundamentally different way in order to overcome the methodological and philosophical challenges of integration. This paper will begin with a short overview of existing efforts to integrate big and thick data before turning to a description of the three phases of the Contextual Analytics methodology. After this description, we will use examples from four recent projects to describe what the three phases look like in practice. Drawing from insights gained while working with clients, the paper will ultimately suggest new ways of achieving meaningful cooperation between the human and data sciences.
INTEGRATING DATA AND HUMAN SCIENCES
A Brief History of Big and Thick Data
Most attempts to define big data focus on the “3 Vs” – volume, velocity, and variety – to demonstrate the sheer size and scope of data sources available today.16 Other definitions include “veracity” and “value” or look to different letters altogether17, but the general concept remains the same: big data is the phenomenon of having massive datasets on human behavior drawn from millions of touchpoints between businesses and organizations and their customers and clients, tracked in a variety of formats. Data analysts use statistical techniques to analyze datasets, and in doing so create new ways of interpreting and classifying relationships between human and non-human actors.18
When the concept of big data was still at its nadir, social scientists recognized its potential complementarity with their own discipline. Their initial attempts to promote the use of “thick data” – a term borrowed from Clifford Geertz and used to describe deep insights into human behavior derived through ethnographic method – failed to garner much interest among data scientists.19 In recent years, however, thick data has become an industry imperative due to shifting priorities around data privacy and ethics. Since the advent of machine learning – a fully-automated tool designed to find relationships in massive pools of data – dozens of studies have called into question the opaque decision-making of their resulting “black box” algorithms.20 Moreover, business leaders increasingly struggle to accept the results of automated algorithms that lack a persuasive account for their findings.21 Now that economic incentives around performance are aligned with ethical imperatives to make more transparent algorithms, interventions on behalf of social scientists for “thickening” and “socializing” the process of data analysis are increasingly cited by politicians, pundits, and industry leaders.22
The Evolution of Integrated Approaches
Mixed-methods approaches often structure their research in the ways most familiar to them – social science first or data science first – and use the other method as a supplement or corrective.23 In presenting learnings on Contextual Analytics, however, we will join others who attempt a more even-keeled integration of the two. For example, while we contend that social scientists and data analysts must also participate in and internalize each other’s research, we join the authors of the “blended” model by extending their recommendation that the merging of insights be rapid, iterative, and done before analysis is fully finished so that one method may help guide the other.24
Moreover, “Living Labs” models – which use coordinated community workshops to test technologies and services in a real-world context – tell us that interaction between teams can start well before the workshop with the analysis of available trace data, subsequently enrichened through participant interaction.25 Like Living Labs researchers, our studies suggest that, when possible, it is beneficial to start a project with “exploratory” data analysis that finds new patterns to inform subsequent ethnographic research protocols.26 We also draw on “Collaboratory” models: one-time workshop events where ethnographers and industry data analysts come together to share their knowledge and experiences.27 While Collaboratories focus on concept development rather than implementation, these workshops demonstrate the benefits of using ethnographic research to slow down traditional data analysis in order to explore more open-ended ways of solving a problem.28
In outlining an integrated approach to algorithm development, we hope to build on existing work as well as present new learnings for what teams must do differently in a corporate setting. Drawing on this dual focus, we aligned social and data science workstreams into a process called Contextual Analytics, to which we will now turn.
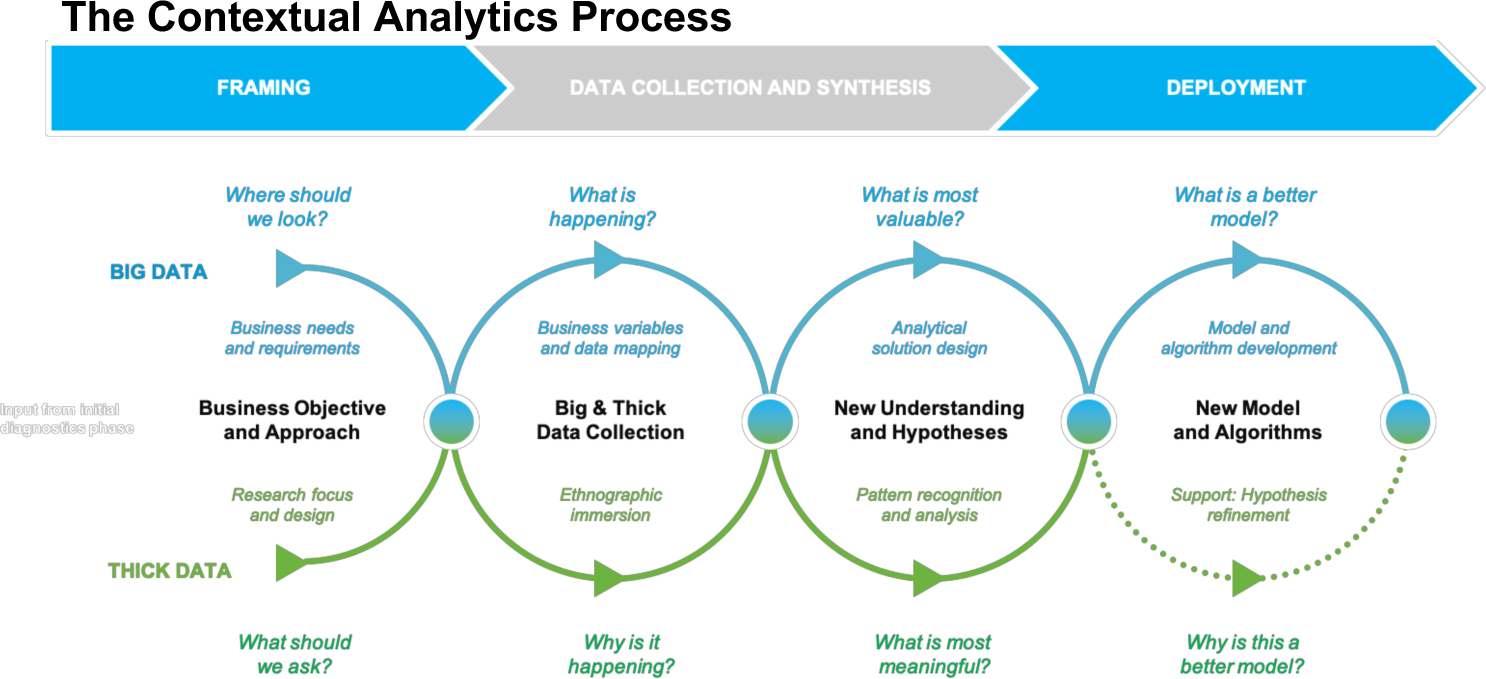
Figure 1. The 12AI Contextual Analytics Process. ReD Associates and Cognizant, 2018. Used with permission.
Contextual Analytics was designed by ReD and Cognizant to allow data analysts, social science researchers, and client data and business teams to work together to address well-established analytics gaps. The process leverages quantitative and qualitative analytical techniques across three project phases – Framing, Data Collection and Synthesis, and Deployment – to build actionable insights for a company’s current situation and produce improved algorithms for generating new insights going forward. Over the past year, we have applied this methodology to high-stakes corporate problems in various industries. Across four projects in particular, we learned several lessons pertaining to the central guiding principle of Contextual Analytics: how can we ensure truly integrated, balanced, and collaborative human science and data science workstreams? Overall, our work so far suggests that there are three critical elements for integrated teams to consider:
1. Specificity in Framing – While strong framing is critical for any research project, there is a greater need for epistemological and logistical specificity in the planning stages when combining data science and social science teams. In order to acquire the right data sets in a timely manner and deploy teams to the right locations, ethnographers need to get specific about what they really need to know and how data analysts can help. Data analysts, in turn, need to be clear about what it will take to acquire and operationalize the necessary data sources. Doing so in a way that avoids hypothesis-driven thinking and allows for agile redirections of the project frame requires practitioners on both sides who are experienced enough to foresee potential problems in team communication and data access.
2. Forced Immersion in Data Collection and Synthesis – The complementarity of social science and data science is most beneficial when a single team conducts research and analysis while in constant conversation, collaborating to share their findings and align on next steps. To do so, practitioners from each of the workstreams must understand how the other practically conducts their projects and what this means for their own work. Thus, to collect and present their data in a way that is mutually beneficial, data scientists and social scientists must briefly, but meaningfully, step into the methodological shoes of the other.
3. Integrated Storytelling in Deployment – The customs around good storytelling vary widely between (and among) ethnographers and data scientists. To get the most out of an integrated approach a common language is needed that borrows the best from both disciplines. Thus, integrated teams must not only produce two separate deliverables – a highly persuasive story behind insights and a model with statistically improved results – but also create meaningful links between those two deliverables. To do so requires practitioners to move out of their respective black boxes and towards a common set of mid-level theories: data analysts by opening their algorithms to tell the stories that the data represents, and ethnographers by pushing beyond grand narratives alone to connect them to testable and sizeable hypotheses.
When these elements are taken into account throughout project design and practice, the resulting collaborative efforts are not necessarily faster or cheaper, but allow for teams to jointly create algorithms that are more grounded, that have better results, and that people in the C-suite can understand.
Project Context for Contextual Analytics
Our paper will now discuss Contextual Analytics in practice, with learnings drawn from four case studies: modeling fraud, increasing the hit rate for prospect targeting, retaining skilled employees, and improving call center operations.
Case 1: Modeling Fraud – The business impact of credit card fraud is high. Banks and retailers lost $16 billion to credit card fraud in 2016, and scammers claimed two million more victims than in 2015.29 Worse, fraudsters move almost ghost-like through the dark web; financial services providers and credit-card facilitators see only the traces that perpetrators leave in data. They know little about what motivates them, or what might scare them away. We wondered what financial institutions might learn if data scientists could gain a firsthand understanding of what the world of credit card fraud looks like. Could they build better fraud detection algorithms?
The question triggered months of study. We met, conversed with, and observed actual fraudsters in New York and Boston and garnered surprising results. Credit card thieves see their line of work as hustling to survive, not a get-rich-quick play. Longevity requires that they move fast and spend small sums of money to stay below the radar. It’s labor-intensive work. That reality opens a different window on how to deter fraudsters: make their work a bit more difficult, and suddenly fraud is a less attractive option.
By taking into account human insights about how fraudsters conduct their work, banks can sharpen their fraud-detection algorithms. For example, knowing that fraudsters send their online orders to vacant houses, banks have the ability to scrape real-estate databases “for-sale” listings and cross-tab them against credit-card transactions to flag potentially suspicious purchases.
Case 2: Increasing the Hit Rate for Prospect Targeting – A global financial services company prides itself on developing advanced algorithms to determine which small-to-medium businesses (SMBs) are best primed for new credit offers via phone or mail. Yet in their own words, one of their blind spots was an understanding of why those SMBs would be receptive to offers. As a result, their current models resulted in an astoundingly low response rate – a mere 3.5% – and in the process left countless business owners feeling spammed by irrelevant offers. Our challenge was to develop ethnographic insight into why SMBs respond or fail to respond to offers at particular times, and to develop and translate those insights into data implications and proxies for building a new, more precise, targeting model.
Through multi-day immersions with over twenty SMBs in the New York Metro area, we uncovered a range of financial challenges that owners face when running their businesses. For the most part, they aren’t business experts, Indeed, owners are somewhat overwhelmed trying to figure out how to run a successful business and often seek personal help in doing so.
We were able to translate our insights into a new model of expanded responsiveness that detailed six components of an “Owner’s Ethos” that makes them more or less likely to respond to an offer. For example, SMB owners with a local mindset are less likely to respond to offers since they are keen to support the community and therefore seek out community banks or local providers instead. From insights such as these, we developed over 170 data proxies, and developed a new algorithm of responsiveness that is set to launch at the start of 2019.
Case 3: Retaining Skilled Employees – The problem of employee churn is a ripe subject for big data analysis. We met with a technology solutions company that was using rich data – from exit interviews to Glassdoor reviews – to identify the segments of their workforce who had a higher historic likelihood of quitting. The company HR department had a few hunches about why particular segments were most at risk, but lacked the human data that would explain why the model marked certain employee groups and departments as “attrition hotspots.”
In order to gather insights on drivers of attrition (and retention) and build a predictive model from them, our approach entailed four collaborative workstreams: the continued quantitative investigation of attrition hotspots and related data proxies; deep dives with employees and those around them, including managers, colleagues, and family / friends; discourse analysis of data gathered with and from human resource teams and in employee town halls; and stakeholder interviews that clarified the cost of attrition and the benefits to solving the issue.
By layering human insight on top of quantitative work, the team developed a values framework that articulated the key rationales for pursuing a career with the company, and how certain values are under threat from a variety of internal and external factors. Each value was then correlated to range of data proxies and weighted for different employee segments – the balance seeker, the risk taker, etc. — to incorporate into the predictive model.
Case 4: Improving Call Center Operations – A leading Nordic energy provider runs a contact center that typically fields calls from two types of customers: those looking to invest in new energy solutions, and those struggling to pay their bills. The provider worried that they weren’t catching a significant amount of the investor population. Meanwhile, employee hours were clogged with calls to from concerned customer discussing their hefty bills. To solve both problems, the provider desired a new predictive algorithm that could streamline operations by suggesting when employees could pre-emptively contact these different customer segmentations.
To identify the markers of each customer segmentation, the ReD and Cognizant team asked what moments matter most to homeowners when it comes to their energy use. Through interviews with homeowners and by shadowing customer calls, ethnographers that people with a “warm” relationship to their energy searched for new energy uses and investments, and those with a “cold” relationship defaulted to the cheapest option and struggled to pay their bills.
These new insights led the integrated team to create an event-based algorithm that indexed customers based on the energy health of their home. They designed proxies to predict whether homeowners are “struggling” or “investing,” and thus could benefit from a call, or if they were “sleeping” and best left alone.
Using examples from these four case studies, our paper will now discuss Contextual Analytics in practice, outlining how the methodology can be applied in each of the three phases.
PHASE ONE: FRAMING
In the first phase of a Contextual Analytics project – Framing – teams are designed to balance quantitative and qualitative methods to better direct the course of data analysis. Ideally, a project is framed so that quantitative data informs the start of an ethnographic investigation by focusing its traditionally broad scope through the statistical identification of promising markets and segments. Ethnographic immersion, on the other hand, generates rich contextual information through open-ended inquiry, and so broadens the data analytics framing process which traditionally relies on hypotheses generated from easily available data sets.
We’ve learned that – despite the best intentions of both teams to work collaboratively in framing – their efforts can be impeded if they don’t specifically account for process silos and problems with data access. To account for the former, a strong project management team needs to ensure frequent communication between both social and data scientists so the two don’t return to old ways of conducting their research independently. For the latter, teams must consider the practical constraints of data access; a particularly relevant challenge given new data protection and privacy laws like those implemented across the European Union in May of 2018. The result: well-framed projects can enrich research and speed up raw data collection, but teams must spend more time planning them upfront.
Contextual Analytics in Practice: The Project Framing Phase
In the framing phase, project goals are two-fold. First, develop research questions to guide the inquiry process: what to ask and why? Second, develop research protocols: who to meet and where? Typically, social scientists and data analysts approach these same goals from different epistemological starting points. Social scientists, with theoretical foundations in ethnographic and grounded theory approaches, frame research in a purposefully broad manner in order to approach a phenomenon without potentially misguided assumptions.30 In this way, framing is abstract and leaves room for serendipity: go after the biggest questions, and narrow the scope based on what shows up as important along the way. Data analysts, however, follows a scientific method approach by starting with a set of hypotheses that could explain the business problem. The input for these hypotheses often comes from business leaders who provide their perspective on the issue or from prior models which explain the situation for different use cases. Thus, data analysis typically begins with a deep understanding of existing data sources and how they’ve been used in the past, along with the preparation of any data that hasn’t been used or analyzed previously.
Despite social scientists and data scientists having different starting points when framing projects, a key value added by the Contextual Analytics process is that the integrated team continuously shares, discusses, and debates any prior analyses, hypotheses, and unknowns they may have before and during the course of the project. By integrating their analytical techniques in response to the specific demands of a given case, an integrated team has the potential to dramatically strengthen their starting point for analysis and algorithm development.
Take, for example, our project on prospect targeting for a large financial services company. Before ReD and Cognizant intervened, the financial company’s data team had embarked on a project to develop new models that would increase the response rate of SMBs to credit card offers received over the phone or via mail. Working in a silo – removed from any insights that a sales team may have had from actually interacting with SMBs – the client data team had relied on a combination of intuition and evidence to frame their analysis. Their intuition led the team to start with analysis of historical data that showed predictability in offer response-rate for other populations. Then, after searching for those same correlations in their lists of SMBs, subsequent data analysis showed a small uptick in the model which gave them the evidence to justify their data use. One data analyst on the project told the ReD and Cognizant team that this framing constituted a “big creative leap” in which their hypothesis was based not on “what would cause credit card conversion now?”, but rather on “there was conversion for this type of problem in the past”; all correlation, with no proof of causation.
Enter Contextual Analytics. After identifying this limitation of the existing model, the ReD and Cognizant team planned their project to start with social science research in order to move past a narrow framing based on existing knowledge – what does the data tell us about the phenomenon? – and towards framing based on open-ended analysis – what does the phenomenon tell us to look for in the data? Instead of going after existing correlations of data, our ethnographic team planned a backwards-engineered segmentation to find the underlying drivers for how financial decisions are made in SMBs; they gathered and studied businesses in different industries, with different revenue and employee size, and then searched for common factors that most affect their probability of responsiveness. This blank-slate segmentation approach allowed the whole team to think creatively around different types of data to start with, including examples of proxies like local mentality: if the business has closer ties to other institutions in their neighborhood, they were less likely to respond to an unsolicited offer. Through their combined efforts, the integrated team was able to envision a sound frame for the project that used social science to make up for a lack of guiding insights.
Where, ideally, a data analysis stream would first develop certain research protocols by sharing hypotheses from past models, in this case those hypotheses couldn’t be trusted without their validation in the population that was actually being studied. That being said, machine learning is powerful, and can find corollaries in troves of data that would confound human analysis. Ethnographers learned to pay special attention to areas where data analysis said the business problem was most pressing, and where parts of research needed to happen. If framing is to succeed, conversations like the above have to happen in the context of each project, based on an honest assessment of limitations and strengths.
Key Success Criteria for the Framing Phase
A proper framing process for Contextual Analytics sets up data and human science for success by customizing interaction between the two workstreams. Yet even the best laid plans of human and data scientists are subject to practical tests within a corporate setting. We will now present two learnings to take into account when framing integrated projects.
Align project management teams to avoid process silos – Without establishing a clear process to guide the mandate of working collaboratively, we’ve seen that teams have a tendency to retract into silos: a data science team working in isolation with a hypothesis dictated by opportunistic data, or a social science team identifying a phenomenon and lines of inquiry unguided by existing analyses. These two silos acutely demonstrate the need to understand and account for one another’s epistemologies when framing a project.
In one project, we saw the firsthand the effects of limiting project framing to a single method. Before starting a project on predicting credit card fraud, our team met with employees of a large bank in the United States that was using their data – from financial transactions and payment records to credit history and call-center interactions – to get a good predictive picture of their clients. Building on their success, the bank sought to use these same datasets to locate fraudsters, assuming that fraud was detectable as deviation from well-established spending patterns. Yet the bank found that, even with the most advanced predictive algorithms, their efforts at combating fraud remained as dismally ineffective as the rest of the country.31 By basing their new hypothesis on recycled data, their analysts simply weren’t looking in the right place.
The above example demonstrates that, even for enterprises with virtually unfettered access to some of the richest troves of user data available, data-driven analysis alone is, ironically, insufficiently capacious to sort through its own information. With loads of unstructured and unused data, those teams are pressured to recover the sunk costs of data collection by quickly finding value in its use.32 Thus, when deciding what questions to ask, overloaded data science teams will typically turn to the low-hanging fruit of “opportunistic” data; sources that are easily available for speedy use. Yet the output of data analysis is only as good as its input; the algorithm was weakened because it couldn’t infer how fraudsters operate without data from the actual fraudsters.
Without a conscious framing process, opportunistic data-use is often the default for data-analysis. This use of old and existing data can be useful when it comes to framing for straightforward or predictable problems – such as inferring a customer’s preferred method of communication with the bank – but it is much less helpful in developing a research question when the scope of that question itself is at issue.33 Nevertheless, as we saw in the fraud project, data analysts are often pushed towards recycling old and opportunistic data sources when faced with challenges. Indeed, in our experience, this tendency to revert to methodological silos threatens both workstreams; it is often easier to take refuge in comfortable framing methods rather than at ways to adapt and change one’s methods. Thus, having a strong project management team across workstreams is critical to ensure that both attempt to actually communicate and build upon one another.
A successful example of an aligned framing effort – where managers take into account how one process can best help the other – came in our project on retaining skilled employees for a technology solutions company. Ethnographers faced a daunting framing task: explore staff loyalty in the broadest sense within a massive organization, and come up with a perspective on what would make their employees more or less likely to leave. With traditional ethnographic framing, researchers would spend several weeks conducting stakeholder interviews and client research in order to find the right place to invest their time and effort. Thanks to the foresight of management and client teams, however, the company agreed to share their internal data beforehand to facilitate the statistical identification of research areas. The data team used this data to pinpoint specific areas where the company found it difficult to keep employees – what they called “attrition hotspots” – and sent ethnographers to figure out why that was the case. In addition, correlations around attrition from the data analysis such as “frequency of communication with supervisors” and “time on bench” helped frame particular aspects of the ethnographic field guide. Quantitative findings thus allowed qualitative researchers to have a less time-intensive process of recruitment and research.
Start early by thinking concretely about data access – Attempts at collaboration often run up against the logistical challenges of data access, timing, and quality. While ethnographers expressed surprise at lengthy data delays, it is well-known among data professionals that they are likely to spend the majority of their time (nearly 70% of it) just getting the data and putting it into a clean, usable format. Moreover, following a spate of governmental programs on the fair and anonymized use of aggregated data, corporations are cautious when it comes to sharing their internal and private data.34 The above considerations suggest that integrated teams must plan carefully in order to account for issues around data access.
All four of the projects cited in this paper encountered some internal issues getting to the data, but data access was perhaps most at-issue in the credit card prospect targeting case. Concerns about sharing customer-level data with an external group led to the client’s requirement of a lengthy and unreasonable onboarding process for the ReD and Cognizant team, including drug tests and a four-month application processing time. This delay meant that the team could not access the financial organization’s massive amounts of internal information, such as neighborhood-level credit card spending, prior prospect responsiveness, and other rich customer-touchpoints. Lack of data had effects on both workstreams. The data analysis team felt limited – or, as one described, “impotent” – since they were unable to contribute in validating and pointing towards new findings. From the human science side, a lack of “quantitative backup” meant social scientists felt they had to be more risk-averse when finding correlations, and were less confident judging feasibility of insights based on an understanding of readily available datasets.
In theory, an integrated approach is one where workstreams are set up to begin their data collection and analysis on an equal footing. But, in reality, that is not always possible, and it may not always be the most adaptive or prudent approach. The data is not always there to start, so quantitative and qualitative tracks will often run at different times. It is important, however, to orchestrate data collection and synthesis so that both tracks can still guide and direct each other as much as possible. In the prospect targeting case, for instance, data analysts made up for lack of internal data by looking to publicly available data they believed the corporation may have, and creatively considering what it told them about new and existing proxies. Social science teams, if delayed, can take advantage of data analysis identification of relevant markets and segments to start putting down boundaries around future research.
PHASE TWO: DATA COLLECTION AND SYNTHESIS
The integration of data and human science workstreams is most critical in the second phase of Contextual Analytics, Data Collection and Synthesis. Data collection takes place in two parallel workstreams: ethnographers observing a small sample size of respondents in the field and data analysts tracking correlations in large datasets. The former is meant to add to and explain quantitative findings, while the latter lends statistical significance to qualitative observations. We’ve learned, however, that synthesis cannot take place during a single event following research. Rather, data collection and synthesis occur simultaneously and iteratively so that each of the workstreams can use their findings to guide the other to new areas of inquiry. This reciprocity is especially important as data analysts guide researchers on which types of data are actually accessible.
When data collection is done independently – each team taking responsibility for only their own realm of expertise – the representation of social-science based insights in the algorithm is put at risk. Thus, collaborative projects require an element of “forced immersion” on behalf of both data analysts and social scientists, where each practitioner purposefully takes an extra step beyond their normal research. Social scientists need not become data experts (or vice versa), but we’ve learned that taking the time and effort to learn how the other side conducts their analysis prepares each team to pre-emptively set up their own work in ways that make it easier to merge, translate, and present findings.
Contextual Analytics in Practice: The Data Collection and Synthesis Phase
Contextual Analytics crucially relies on the use of social science research to ground possible correlations from data analysis and to identify hypotheses found outside the margins of available datasets. Take, for example, our project on improving call center performance. Due to the team’s lack of data access, data collection began with open-ended ethnographic inquiry: how do homeowners relate to their energy? By spending time with homeowners across a wide demographic range, researchers found that the energy provider could benefit from a more general understanding of the events in the life of a homeowner. These events most often correlated with energy consumption and smart-meter data, leading the team to suggest proxies for which the home – rather than the homeowner – was the locus of analysis.
By providing proxies early and often in data collection, ethnography can help jumpstart the quantitative process of data analysis. In Contextual Analytics projects, ethnographic teams collect insights in ways that roughly map onto potential data sources. Thus, after only a few weeks of observing customer calls with the energy provider and setting up post-call interviews, ethnographers had filled their field notes with new and promising correlations. The team focused on event-based proxies – like the purchase of a new home or flat which primed “warm” homeowners to invest in energy – because they believed such insights could be tracked in easily-available data. Yet while opportunistic data sources may risk showing correlation without causation, rudimentary ethnographic findings like the above run the opposite risk. After hunting for and hinting at various correlations from the field, then, qualitative findings need “quantitative backup” to prove their long-term value.
The term “quantitative backup,” coined by one of ReD’s researchers on the credit card response project, refers to the process of having a data analyst check possible proxies against available data in order to demonstrate sufficient frequency and help prove that a particular correlation in the thick data isn’t anomalous. After identifying hypotheses from the field and potential proxies for those hypotheses, the process of checking correlations requires a data analyst to assess the feasibility of translating that insight quantitatively using their knowledge of existing data sources.
By checking in with the data analysts embedded within their team, researchers studying the call center found that many of the events they identified – the installation of a solar panel, the exchange of heating information, a recent move, financial distress – had corresponding variables within existing data sources. Even without access to internal data at the time, the data analyst had the foresight and expertise to inform the team that much of the data they anticipated using existed in a large number of systems, or in datasets that they couldn’t trust due to missing or incomplete fields. Thus, validation proved helpful in pointing the team towards finding new proxies to replace their rudimentary attempts.
Key Success Criteria for the Data Collection and Synthesis Phase
Quantitative and qualitative methodologies offer ways to both explore new and validate existing correlations during data collection and synthesis, but only if the two are working in concert. We will now demonstrate the necessity of data and social scientists understanding each other’s processes, and the element of forced immersion that ensures proper presentation and translation of insights between workstreams.
Ethnographers need to take a stance on the data – As one of our data analysts cautioned the prospect targeting team, ethnographers need to be careful when choosing which findings to give to the data team for testing, and what format they choose to deliver them in:
“We have [a data team] for 4-8 weeks, and that is the time we have. Once we have these resources, we have to be specific about what we can deliver and in what time. It will depend on how difficult it is to scrape and how difficult it is to get creative with the data. It’s not a big deal to just go out and buy the data, that’s easy. It’s the creativity and thinking that takes time.”
Ethnographers tend to underestimate the amount of time and effort it takes for data analysts to translate qualitative insights into variables that can be meaningfully included in the model. The more creative the finding, the harder it will be to unpack it. Given their limited time frame, ethnographers cannot rely on the data analysts to undertake this lengthy translation process by themselves. This problem calls for ethnographers to take a stance on their data by delivering not just insights, but rudimentary proxies that take accessible data sources into account.
Ethnographers can develop better proxies during data collection if they take a step beyond their own human-centric stories and gain a better understanding of the data that analysts use to capture them. On the credit card project, for example, the social science team became very familiar with the various prospect targeting models that the client had developed based on primarily firmographic data. Having this view allowed the ethnographers to better prioritize new hypotheses and data proxies for extending and improving the targeting model using different types of proprietary data that the client had already collected.
Data analysts need to embrace the intangible – Unless data science teams strive to understand the underlying insights delivered by the ethnographic team, and not just the accompanying data proxies, the representation of those insights in the algorithm is put at risk. During the course of the credit card prospect targeting project, for example, we saw firsthand how a lack of qualitative understanding can disrupt the implementation of insights. The ethnographic team surveyed over 20 SMBs and found that those with a strong “community mindset” were much less likely to respond to an unsolicited credit card offer. In order to track this insight, the ReD and Cognizant team delivered the finding along with a list of proxies they believed would indicate a business would fall into that category: proximity to local bank, number of credit cards owned, change in geo-location field as a sign of frequent relocation, etc. Upon presenting their findings, however, the client told researchers that turning those insights to variables would take several months. The client didn’t understand that ReD and Cognizant were proposing new uses for old data fields, which gave them new meanings and situations based on fresh insights. As a result, they delayed model development in order to test each individual proxy for completeness and validity.
In order to make the leap from qualitative insight to quantitative proxies, data teams must get familiar with high-level insights that cannot be measured in a direct 1:1 relationship with the data sources. That is, the use of qualitative observation requires data analysts to think of the underlying human behaviors and actions behind an insight, and how both new and existing data sources can capture them in creative ways. Thus, the best data analysts are not just great mathematicians, but also have what C. Wright Mills called a “sociological imagination”: the ability to pull their thinking away from the technical problem at hand, and to understand the interactions that are actually taking place between the points within a dataset and the contexts into which they will be applied.35
To cultivate sociological imagination, data analysts working with ethnographers likely need to take some part in the ethnographic research process when developing the first concepts of what the proxies will be. A data analyst was able to fulfill this role in the prospect targeting case. He joined the team on workday tagalongs, and left feeling that he grasped where some of the insights came from and thus what the essential point to identify through the proxy really was. For example, ethnographers found that SMB owners who were plugged into “expert networks” like trade and industry associations or LinkedIn were more likely to turn to those networks and less likely to respond to offers. While the client’s data science team could not initially conceptualize any feasible proxies to track this insight for the first model, this particular data analyst was able to push the client’s team to see if any patterns in transaction data could indicate this type of behavior. Expert data analysts are up to the task of creatively translating social-science based insights, but only after taking a methodological leap of faith in order to understand the contexts from which those insights actually emerge.
PHASE THREE: DEPLOYMENT
Central to the final phase of Contextual Analytics is the development of two critical deliverables: 1) the final model with a proof point that demonstrates the impact of social-science hypotheses on the algorithm, and 2) the overarching “story” that is able to explain why that algorithm actually works.
Neither the story nor the statistics, however, are particularly novel on their own. Rather, the power of a Contextual Analytics project is that collaboration between data and social scientists allows the two deliverables to be linked through a set of mid-level theories designed to balance the specificity of big data proxies and the high-level inspiration of ethnographic narratives.
Contextual Analytics in Practice: The Deployment Phase
Neither big nor thick data can be used as the sole end-point of algorithm development. Qualitative insights are often thought too small to be reliable on their own. Numbers alone, on the other hand, lack the persuasive power to enact change within an organization. Thus, after aligning on proxies, integrated workstreams show their value to the client through two mutually informative deliverables – numbers made emotional, and stories given statistical weight
According to a 2017 Cognizant report, most corporate decision-making remains “gut-based” despite the infusion of new data collection, management, and analytical technologies.36 This is because data analysts find it difficult to keep on top of business needs while juggling multiple algorithm development projects.37 As a result, data teams are often technically well-prepared, but ill-equipped to demonstrate the overarching business impact of their “black box” algorithms. In response, social scientists focus on providing the “why” behind new correlations in the model. In the project on curbing attrition and retaining skilled employees, for example, the data science team created a list of over 200 proxies for predicting attrition. This level of granularity meant little to the human resource officers who sought to understand why that attrition happened in the first place. Simultaneously, then, the social science team created a values framework to map onto the proxies that predict attrition and, more importantly, describe the motivations and needs of employees when it comes to their work-life ambitions. This values framework ultimately gave the HR team the explanation they needed in order to identify key employee rationales behind their choosing to stay with or leave the company. The ethnographic “big story” provides buy-in and articulates need on behalf of big data.
As applied ethnographers quickly learn while working in a corporate context, however, scale is often valued over story. Moreover, insights based on ethnographic research can run the risk of seeming anecdotal. As an ethnographer on the improving call center operations project put it, even if the team had a great story to tell, that story is at its strongest when coupled with statistical proof: “It’s that magical number that we are chasing. You need the numbers, and you need them to concretely say that we improved the model by this much, and the client operations improved this much because of it.”
Key Success Criteria for the Deployment Phase
The creation of two separate, though mutually informing, deliverables provides the client with the technical tools and persuasive stories to build effective and convincing algorithms. When the integrated team separates to build different products. they again tend to focus on the type of product that comes easiest to them: ethnographers developing a governing thought and data scientists focusing on specific proxies. Through all the cases, however, we saw the importance of keeping the two workstreams aligned by pushing each practitioner to embrace mid-level theories in their work.
Focus on mid-level theory – A concept first developed by Robert K. Merton, mid-level theory is an approach to sociological theory construction that balances a focus on the overarching big idea and the particularities of various lower-level hypotheses. As Merton defines the term:
“…what might be called theories of the middle range: theories intermediate to the minor working hypotheses evolved in abundance during the day-by-day routine of research, and the all-inclusive speculations comprising a master conceptual scheme.”
In the case of Contextual Analytics, mid-level theory functions as a method by which both data and social scientists embrace the needs of the other in order to build more well-rounded deliverables.
For social scientists, embracing big data methods means achieving a level of specificity in insights that might be uncommon and uncomfortable for many ethnographers. Given rapid advances in analytics, it is no longer helpful to produce only a single, abstract overarching theory to sum up an entire project. Rather, ethnographers need to meet in the middle with data analysts by splitting their theories into more granular and focused recommendations custom-tailored for different versions of a model. This specificity is critical to ensure that the stories ethnographers tell are internalized and utilized to their maximum capacity across a company’s data portfolio.
Aligning on mid-level theories also pushes data scientists to go beyond what can be meaningfully quantified in the data. For example, while building another iteration of the model in the prospect targeting case, data analysts presented several proxies that hadn’t yet passed the client’s compliance muster, and therefore pushed the boundaries for what the client considered technically feasible in the model. Nevertheless, using examples from ethnographic work, the data team persisted in their argument to include these proxies and convinced the client that they delivered some “incremental value.” By elevating their thinking past the technical, they ensured that the next version of the model would stay true to deep human insights.
Ensuring the continued use of integrated social science and data science methodologies is not as easy as checking two separate boxes. Rather, by baking mid-level theory into the way that they produce deliverables, teams ensure that the collaborative spirit of Contextual Analytics extends through the project’s resolution.
CONCLUSION
Extending Frames of Reference
In practice, the building of contextually-informed algorithms calls for qualitative and quantitative studies that go beyond merely observing the complementarity of statistical analysis and ethnographic research.38 Indeed, as we have seen, simply putting the practitioners of big and thick data together does little to enable their practical collaboration. Both social scientists and data analysts must make attempts to better understand one another’s project processes in each phase – Framing, Data Collection and Synthesis, and Deployment – in order to facilitate the integration of their findings. We have learned that whether through frequent communication, forced immersion, or mid-level theory, a Contextual Analytics project relies on practitioners who are willing to move beyond their original frames of reference. We encourage continued conversations around the integration of big and thick data workstreams and the practical collaboration of their practitioners, and hope that future discussions will further engage the practicalities of Contextual Analytics processes in corporate settings.
NOTES
1. Oremus, Will (2017, October 16). “How ‘Big Data’ Went Bust. And what comes next.” Slate.
2. Dykes, Brent (2018, August 22). “Build a Data-Driven Culture, One Meeting at a Time.” Forbes.
3. Burton, Besty and Hank Barnes. (2017, August 11). “2017 Hype Cycles Highlight Enterprise and Ecosystem Digital Disruptions: A Gartner Trend Insight Report.” Gartner.
4. Boelstorff, Tom (2015). “Making Big Data: In Theory.” Boelstorf and Maurer (Eds.), Data, Now Bigger and Better! (87-108). Chicago, IL: Prickly Paradigm Press.
5. Gartner (2017) “Forecast: Internet of Things – Endpoints and Associated Services, Worldwide, 2017.” Gartner.; PricewaterhouseCoopers (2015): “Seizing the Information Advantage: How organizations can unlock value and insight from the information they hold.” A PwC report in conjunction with Iron Mountain.
6. Wang, Tricia. (2013, May 13). “Big Data Needs Thick Data.” Ethnography Matters;
7. Rattenbury, T. and D. Nafus (2018): “Data Science and Ethnography: What’s Our Common Ground, and Why Does It Matter?” Ethnographic Praxis in Industry 2017.
8. Haines, J. (2017): “Towards Multi‐Dimensional Ethnography.” Ethnographic Praxis in Industry Conference Proceedings 2017.
9. Kolsto, E. (2017): “A Researcher’s Perspective on People Who Build with AI.” Ethnographic Praxis in Industry Conference Proceedings 2017.
10. Crawford, Kate (2017): “The Trouble with Bias.” Conference on Neural Information Processing Systems (NIPS), Keynote Address 2017.
11. See, for example, the Facebook-funded post on the New York Times: (2018) “Artificial Intelligence: How We Help Machines Learn.” The New York Times Paid Post.
12. Boelstorff (2015)
13. Seaver (2015): 37.
14. Ibid.
15. Ibid. 44
16. Salganik, Matthew (2017) Bit by Bit: Social Research in the Digital Age. Princeton University Press: 18
17. Lupton, Deborah (2015, May 11) “The Thirteen Ps of Big Data,” This Sociological Life.
18. Donoho, David. (2015) “50 Years of Data Science.” In Princeton NJ, Tukey Centennial Workshop.
19. Wang (2013); Geertz, Clifford. (1973). The interpretation of cultures: selected essays. New York: Basic Books.; Madjsberg, Christian (2017) Sensemaking: The Power of the Humanities in the Age of the Algorithm. New York: Hachette Books.
20. The data scientist Cathy O’ Neil exposes some of the biased data behind opaque algorithms used to predict patterns in policing and felony – algorithms which, through their aura of ostensible objectivity, “create the reality they purport to describe.” O’Neil, Cathy (2016) Weapons of Math Destruction: How Big Data Increases Inequality and Threatens Democracy, Crown Publishing / Random House. See also Osoba, O. and W. Welser IV (2017): “An Intelligence in Our Image: The Risks of Bias and Errors in Artificial Intelligence.” Santa Monica, Calif.: RAND Corporation, RR-1744-RC.
21. Brynjolfsson, Erik and Andrew McAfee (2018): “The Business of Artificial Intelligence: What it can – and cannot – do for your organization.” Harvard Business Review.
22. Storey, Margaret-Anne (2016, May 4) Lies, Damned Lies and Software Analytics: Why Big Data Needs Thick Data [Webinar].
23. Lepri, Bruno et al. (2017) “The Tyranny of Data? The Bright and Dark Sides of Data-Driven Decision-Making for Social Good” in Transparent Data Mining for Big and Small Data: 3 – 24
24. Ibid.
25. One such example is the “Laboratorio Urbano” in Bogota, Colombia, where city government, citizens, architecture firms, and academic institutions collaborated to test out pilot plans for new mobility and safety policies in the rapidly changing city. (The Tyranny of Big Data, 16) For other creative uses of public data see: Nafus, Dawn (2016). “The Domestication of Data: Why Embracing Digital Data Means Embracing Bigger Questions.” Ethnographic Praxis in Industry Conference Proceedings. 2016. 384-399.
26. Smith, A. (2018). “Smart cities need thick data, not big data.” The Guardian. Accessed April 18, 2018
27. Following an Anthropology of the Contemporary (ARC) model, Collaboratories examine the tactics of experts in order to interrogate their traditional methods of knowledge production. Lepri, Ruppert, Penny Harvey et al. (2015) “Socialising Big Data: From concept to practice.” CRESC Working Paper Series. CRESC, The University of Manchester and the Open University.
28. Ibid.
29. Pascual, Al et al. Javelin Strategy and Research. (2017, February 1) Identity Fraud: Securing the Connected Life.
30. See Creswell, J. W. & Poth, C. N. (2017). Qualitative inquiry and research design: Choosing among five approaches (4th ed.)
31. Almost half of all Americans have had an experience with credit card theft in the last five years, and financial losses to credit from fraud are on track to reach $22 billion annually by 2022. Knieff, Ben. Universal Payments Aite Group. (2016): “2016 Global Consumer Card Fraud: Where Card Fraud is Coming From” Boston, MA: 7.
32. Koslo (2017)
33. Madjsberg, Christian. (2018, February 23). “Thanks, Robots! Now These Four Non-Tech Job Skills Are in Demand.” Fast Company.
34. Crook, Izaak. (2018, Apr 06). “How GDPR Will Affect Data Science.” Dataconomy.
35. Mills, C. Wright (1959) The Sociological Imagination. New York: Oxford University Press.
36. Krishnamurthy, Karthik, et al. Cognizant. (2017). “Analytical Storytelling: From Insight to Action.” Cognizant White Paper: 4.
37. Kolsto (2017)
38. Venturini, Tommaso and Bruno Latour (2010) “The Social Fabric: Digital Traces and Quali-quantitative Methods.” Proceedings of Future En Seine.
REFERENCES CITED
Blok, A. and M.A. Pedersen
2014 “Complementary social science? Quali-quantitative experiments in a Big Data world.” Big Data & Society 1(2):1–6.
Boelstorff, Tom
2015 “Making Big Data: In Theory.” Boelstorf and Maurer (Eds.), Data, Now Bigger and Better! (87-108). Chicago, IL: Prickly Paradigm Press.
Bornakke, Tobias and Brian L. Due.
2018 “Big-Thick Blending: A method for mixing analytical insights form big and thick data sources.” Big Data and Society: 1: 1-16.
Bowker, G. C.
2013 “Data Flakes: An Afterward to ‘Raw Data’ Is an Oxymoron”, in L. Gitelman (eds) “Raw Data” Is an Oxymoron, MIT Press, Cambridge, MA: 167-171.
Boyd, D. and Kate Crawford
2012 “Critical questions for Big Data: provocations for a cultural, technological, and scholarly phenomenon”, Information, Communication & Society, 15 (5): 662-79.
Burton, Besty and Hank Barnes
2017 “2017 Hype Cycles Highlight Enterprise and Ecosystem Digital Disruptions: A Gartner Trend Insight Report.” Gartner. August 11, 2017.
Crawford, Kate
2017 “The Trouble with Bias.” Conference on Neural Information Processing Systems (NIPS), Keynote Address 2017.
Creswell, J. W. & C.N. Poth
2017 Qualitative inquiry and research design: Choosing among five approaches (4th ed.). Sage Publications, 2017.
Crook, Izaak
2018 “How GDPR Will Affect Data Science.” Dataconomy. Retrieved from: https://dataconomy.com/2018/04/how-gdpr-will-affect-data-science/. April 06, 2018.
Facebook, The New York Times Paid Post.
2018 “Artificial Intelligence: How We Help Machines Learn.” The New York Times Paid Post. Retrieved from: https://paidpost.nytimes.com/facebook/artificial-intelligence-how-we-help-machines-learn.html?tbs_nyt=2018-feb-nytnative_apmod&cpv_dsm_id=189293206.
Frank, Malcolm, Paul Roehrig, and Ben Pring
2017 What To Do When Machines Do Everything: How to Get Ahead in a World of AI, Algorithms, Bots, and Big Data. New York: Wiley, 2017.
Geertz, Clifford
1973 The interpretation of cultures: selected essays. New York: Basic Books.
Haines, Julia Katherine
2017 “Towards Multi‐Dimensional Ethnography.” Ethnographic Praxis in Industry Conference Proceedings 2017.
Kolsto, Ellen
2017 “A Researcher’s Perspective on People Who Build with AI.” EPIC Perspectives 28 September 2017.
Knieff, Ben. Universal Payments Aite Group.
2016 “2016 Global Consumer Card Fraud: Where Card Fraud is Coming From.” Boston, MA. Retrieved from: https://www.aciworldwide.com/-/media/files/collateral/trends/2016-global-consumer-card-fraud-where-card-fraud-is-coming-from.pdf
Krishnamurthy, Karthik, Melissa Morello, and James Jeude. Cognizant.
2017 “Analytical Storytelling: From Insight to Action.” Cognizant White Paper. Retrieved from: https://www.cognizant.com/whitepapers/analytical-storytelling-from-insight-to-action-codex2475.pdf
Lepri, Bruno, Jacopo Staiano, David Sankokoya, Emmanuel Letouze and Nuira Oliver.
2017 “The Tyranny of Data? The Bright and Dark Sides of Data-Driven Decision-Making for Social Good” in Transparent Data Mining for Big and Small Data. 3: 3 – 24.
Lupton, Deborah
2015 “The Thirteen Ps of Big Data,” This Sociological Life. Retrieved from: https://simplysociology.wordpress.com/2015/05/11/the-thirteen-ps-of-big-data/. May 11, 2015.
Madjsberg, Christian
2017 Sensemaking: The Power of the Humanities in the Age of the Algorithm. New York: Hachette Books.
2018 “Thanks, Robots! Now These Four Non-Tech Job Skills Are in Demand.” Fast Company. February 23, 2018.
Margolis, Abby
2013 “Five Misconceptions about Personal Data: Why We Need a People-Centered Approach to ‘Big’ Data.” Ethnographic Praxis in Industry Conference Proceedings 2013.
Mills, C. Wright
1959 The Sociological Imagination. New York: Oxford University Press.
Nafus, Dawn
2016 “The Domestication of Data: Why Embracing Digital Data Means Embracing Bigger Questions.” Ethnographic Praxis in Industry Conference Proceedings 2016.
O’Neil, Cathy
2016 Weapons of Math Destruction: How Big Data Increases Inequality and Threatens Democracy. New York: Crown Publishing & Random House.
Oremus, Will
2017 “How ‘Big Data’ Went Bust. And what comes next.” Slate. Retrieved from: http://www.slate.com/articles/technology/technology/2017/10/what_happened_to_big_data.html. October 16, 2017.
Osonde A. Osoba and William Welser IV
2017 “An Intelligence in Our Image: The Risks of Bias and Errors in Artificial Intelligence.” Santa Monica, Calif.: RAND Corporation, RR-1744-RC.
Pascual, Al, Kyle Marchini, and Sarah Miller. Javelin Strategy & Research
2017 “2017 Identity Fraud: Securing the Connected Life.” Retrieved from: https://www.javelinstrategy.com/coverage-area/2017-identity-fraud. February 21, 2017.
PricewaterhouseCoopers
2015 “Seizing the Information Advantage: How organizations can unlock value and insight from the information they hold.” A PwC report in conjunction with Iron Mountain.
Rattenbury, Tye and Dawn Nafus
2018 “Data Science and Ethnography: What’s Our Common Ground, and Why Does It Matter?” EPIC Perspectives, 7 March 2018.
Ruppert, Evelyn, Penny Harvey, Celia Lury, Adrian Mackenzie, Ruth McNally, Stephanie Alice Baker, Yannis Kallianos, Camilla Lewis
2015 “Socialising Big Data: From concept to practice.” CRESC Working Paper Series. CRESC, The University of Manchester and the Open University.
– – –
2015 “A Social Framework for Big Data.” CRESC Working Paper Series. CRESC, The University of Manchester and the Open University.
Salganik, Matthew
2017 Bit by Bit: Social Research in the Digital Age. Princeton & Oxford: Princeton University Press.
Seaver, Nick
2015 “Bastard Algebra” Boelstorf and Maurer (Eds.), Data, Now Bigger and Better! (27 – 46). Chicago, IL: Prickly Paradigm Press.
Smith, Adrian
2018 “Smart cities need thick data, not big data.” The Guardian. Retrieved from: https://www.theguardian.com/science/political-science/2018/apr/18/smart-cities-need-thick-data-not-big-data. May 18, 2018.
Stirrup, Ashley
2018 “The New “V” for Big Data: Virtue,” Business 2 Community, 18 January 2018. Retrieved from: https://www.business2community.com/big-data/new-v-big-data-virtue-02004798. January 31, 2018.
Storey, Margaret-Anne
2016 Lies, Damned Lies and Software Analytics: Why Big Data Needs Thick Data [Webinar]. In ACM SIGSOFT Webinar Series. Retrieved from: https://www.slideshare.net/mastorey/lies-damned-lies-and-software-analytics-why-big-data-needs-rich-data. May 4, 2016.
Venturini, Tommaso and Bruno Latour
2010 “The Social Fabric: Digital Traces and Quali-quantitative Methods.” 2010 Proceedings of Future En Seine.
Wang, Tricia
2013 “Big Data Needs Thick Data.” Ethnography Matters. Retrieved from: http://ethnographymatters.net/blog/2013/05/13/big-data-needs-thick-data/. May 13, 2010.
Wilson, William J., and Anmol Chaddha
2010 “The Role of Theory in Ethnographic Research.” Ethnography 10(4): 549-564.