
Case Study—Based on experience of working in the Department of School Education, Government of Haryana on a Management Information System being built to reduce administrative workload on teachers and bureaucrats, this case study describes how ethnography was used to understand and address the problem of technology adoption in a large bureaucracy. Ethnography helped the Department in framing the problem of adoption as one of lack of adequate Digital Literacy within the organization and in developing strategies to address it. Digital Literacy workshops were conducted to improve broader Digital Literacies in the Department, which improved literacy levels by 48%. For ensuring sustainability of this initiative, the Department instituted a continuous Digital Literacy program, which will support the adoption of multiple technology projects in the future.
Keywords: Management Information System, Technology Adoption, Bureaucracy, India, South Asia, Organizations, ICT4D
INTRODUCTION
Federal, state and local governments in India deliver critical public goods and services to over one billion people. In the summer of 2015, India’s prime minister announced the state’s ambitious “Digital India” program1, incentivizing federal, state, and local governments to use Information and Communication Technologies (ICTs) to efficiently and transparently deliver these services. But the Indian bureaucracy is yet to completely modernize its own operations and build staff capacity to deliver services. Numerous ICT enabled e-governance initiatives have been implemented in India so far, but only a few of these have succeeded in achieving intended outcomes. While academic anthropologists have explained that these failures are a result of lack of deep understanding of the users (citizens) and their context on part of the governments (Sreekumar 2007; Arora and Rangaswamy 2013), we do not know a lot about how ethnographic praxis could help improve the implementation of e-governance initiatives in the public sector in India or preventing such projects from resulting in eventual failure (Sreekumar 2007). This case study draws from the experience of International Innovation Corps (IIC)2 Fellows working for the Department of School Education, Government of Haryana in India, on increasing the adoption of a Management Information System (MIS) aimed at reducing administrative workload on teachers and bureaucrats across the state. The Fellows used ethnography to understand the problem of adoption by framing it as one of lack of adequate Digital Literacy in the organization. Subsequently, ethnography helped the Fellows to enable the Department to devise long term strategy to improve adoption of this large scale, public sector e-governance initiative. Using thick description (Geertz 1977) of the Department work and engaging with academic literature, Fellows were able to make necessary recommendations to the Department so as to increase adoption of the MIS. This case study shows how ethnography is not only helpful, but in fact indispensable to government organizations in successfully using ICT to deliver critical public services.
E-GOVERNANCE IN INDIA
Digital India is a flagship programme of the Government of India that aims to make India a digitally empowered society. It was launched on July 2, 2015 by the Prime Minister of India. Through this programme, the Indian Government intends to create digital infrastructure, digitally connect rural India, extend e-services to remote parts of the country and digitally empower its citizens.3
In Digital India, two initiatives are worth noting- the National e-Governance Plan (NeGP) and the National Digital Literacy Mission (NDLM). The NeGP focusses on making government services easily accessible to the public through e-service delivery outlets (electronic booths) across the country. As a result of which, the government initiated a slew of e-governance projects to ensure efficient, transparent and reliable electronic service delivery to its citizens. The NDLM scheme imparts computer skills to Indian citizens across the country. It trains people to use mobile phones, tablets etc, send/receive emails and search for information on the Internet. An eligible household can nominate one person from their family who is then enrolled under this program in a nearby Training Center/Computer Service Centre (CSC)4
Such efforts by the Indian government are not a new phenomena. Electronic Governance, commonly referred as the e-Governance, has been a priority as early as 1977 (Sreekumar 2007). However, in the past such e-governance projects started by the government of India have mostly failed to achieve their intended outcomes (Sreekumar 2007; Arora and Rangaswamy 2013). For example, when the government in Karnataka state of India started digitizing land records so as to achieve higher transparency and efficiency, it was found that digitization actually increased corruption in the system and that it actually led to concentration of land in certain market players (Benjamin et al. 2007).
HARYANA STATE’S QUALITY IMPROVEMENT PROGRAM
Haryana, one of the smaller states in Northern India, has over 15,000 government schools, with 2.7 million5 students and 125,000 staff members.6 Over the past decade, the Government of Haryana has implemented a range of initiatives to improve access and equity of public schools in the state. However, learning levels in public schools continue to be lower than learning levels in private schools7. As a result, even though overall enrolment is rising in Haryana’s schools, the enrolment is shifting from government to private schools8. In order to address this problem, the Department of School Education, Government of Haryana entered into a partnership with a premier management consulting firm in August 2013. With help from the management consulting firm, the government developed a comprehensive plan to improve Learning Level Outcomes (LLOs) in the state9. This transformation plan, referred as the Quality Improvement Program (QIP), consisted of initiatives to measure LLOs, orient the Department work towards improving academic quality, and address school-segment specific issues. The initiatives focused on improving monthly assessments, revising textbooks, teacher training, maintaining Pupil Teacher Ratio10, improving school inspections and monitoring process and bridging the grade level gap in classes one through five.
While these initiatives focussed on school level interventions for improving quality of education, the Department decided to develop a Management Information System (MIS) to aid the bureaucracy in taking every day decisions based on accurate data. The MIS was initiated to develop an integrated data infrastructure that would become the single source for all information for the data required by the Department. It was aimed to reduce repeated data requests by Department from schools so that teachers get time to focus on teaching rather than administrative work. The MIS would have ready availability of authentic data with simple data collection processes. The MIS would have in-built capability to generate predefined reports as well as the flexibility to produce ad-hoc customized reports as and when required. In addition to this, the Department also sought to redesign some of the key administrative processes (like staff appointment, staff transfers, promotions etc.) with the end goal of making these processes more efficient.
Until the conception of the MIS, the Department did not maintain a centralized repository of data about schools, students, and employees in the state. As a result, before any decision was made, the Department staff would send requests to individual schools and teachers to put together reports regarding the numbers of students in various categories11. Such a workflow would result in inaccurate data and introduce inordinate delays in decision making. The Department would get different numbers from different sources and on many occasions the Department just would not be able to get in touch with the concerned school representative in time. The administrative work burden far exceeded the academic work burden on the teachers, so much so that the consultants and government speculated it to be a major reason for low learning level outcomes in Haryana. This presented a need for the Department to not only relieve teachers from unnecessary administrative work, but to also aide the bureaucrats in making every day decisions backed with sound data sources, and in general enabling the Department to become a data driven organization. The Department hired a technology vendor to build a Management Information System from scratch with help from the consulting firm and additional funding from the Michael and Susan Dell Foundation (MSDF)12.
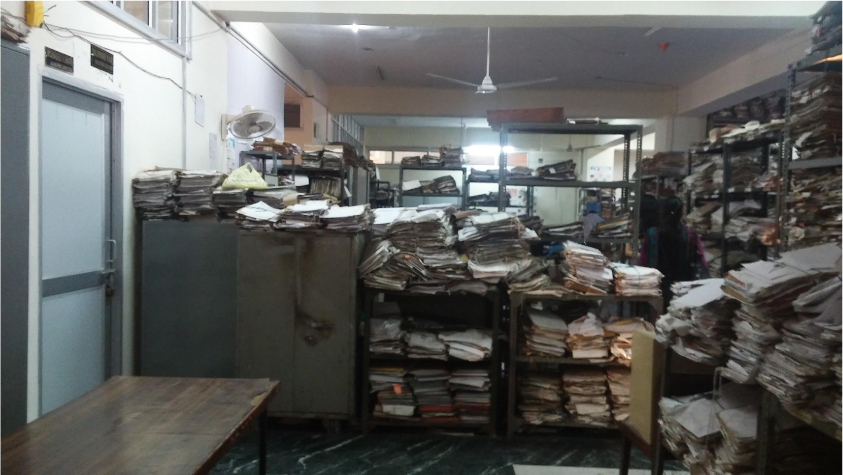
Figure 1 Current stack of file that MIS aims to replace with computer generated reports
ETHNOGRAPHY IN THE INDIAN BUREAUCRACY
It was anticipated that the adoption rates of the new MIS would be low and hence the Department felt a need for employing innovative adoption strategies from the get go. In anticipation of the challenges, the Department along with the MSDF brought in IIC Fellows to help the Department increase adoption of the MIS. The IIC team’s mandate was to, “…improve the utilization and effectiveness of an [Information Technology] (IT) platform for tracking school resources, personnel records, and student performance, among other parameters…”13.
In order to fully understand the problem and the reasons for low adoption, the IIC Fellows spent two months studying the end users. These users were mainly headquarter and block/district14 office staff- branch15 superintendents, computer operators16, data entry operators, block and district officers and Directors. The Fellows chose to work with these interlocutors as against (or in addition to) teachers and principals because the office staff were identified to be the eventual end users of MIS reports.
Before addressing the problem as one of low adoption as identified by other stakeholders, the team decided to conduct their own evaluation of the current status of MIS implementation. The Fellows met with various Department staff, attended monthly project meetings and conducted interviews across the Department to arrive at an independent understanding of the situation. The Fellows developed an understanding of the Department and how it worked as intimately as possible. While searching for organizational charts, roles and responsibilities documents for each functionary, the Fellows found that none of this documentation was available. While going through the System Study Report17 of the MIS, they realized that the technology vendor had access to this information, but only second hand as is apparent from the following quote by a business analyst, “…We studied the Education Department workflow by analysing documents given to us. Meeting personnels from each branch was practically not possible for us…” In such a situation, Fellows decided to conduct interviews with various staff members and participate in their daily work. They found that this was the most appropriate way to understand the ways in which organizational hierarchy panned out and the specific roles and responsibilities of various staff members as the documentation made available to them consisted of incomplete information about the Department and its staff and their roles and responsibilities.
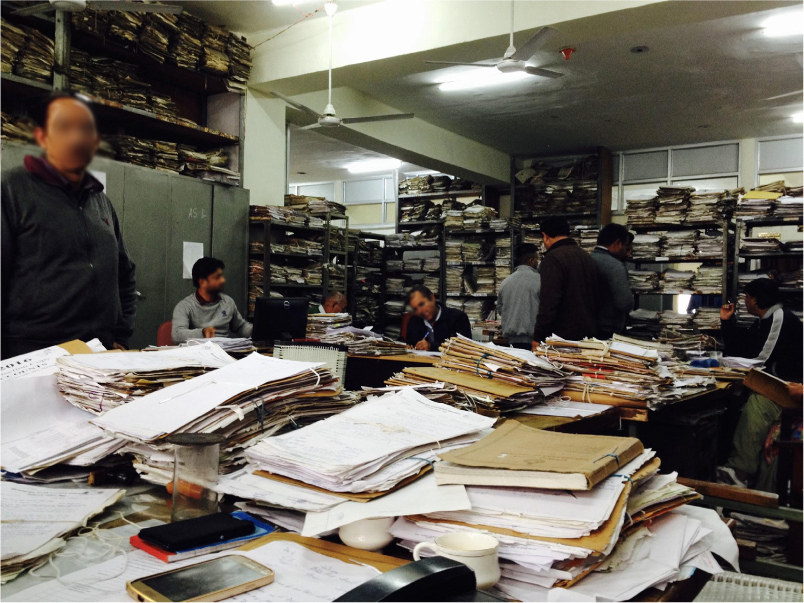
Figure 2 Conducting interview with superintendent of one of the branches in the Department
Fellows started working in various branches within the Department. In many cases, offices had no name plaques and, given the size of the organization, many people were unaware of other departments or the location of different branches (even if they were located in the same building).
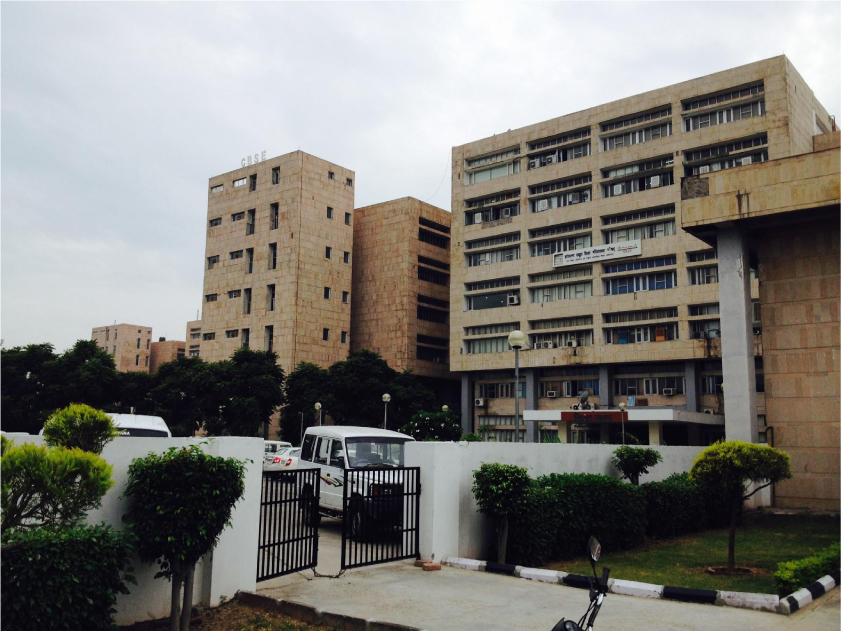
Figure 3 The Department complex is a set of two interconnected 6 storey buildings
In such a scenario, trying to find a specific person’s desk required walking around the office building, asking staff at random. Originally seen as a waste of time, this same activity opened up the bureaucracy to the IIC Fellows. The Fellows understood the physical space much better in their exploratory walks around the building as well as recognising which branches were easier to find, and which staff members were hard to get hold of. It is in this way ethnographic research became indispensable to understanding the work that the Department really did and the ways in which its staff members really requested and processed information from subordinates as well as superiors. Other research methods like surveys could have not accommodated for the flexibility that ethnography allowed. The Fellows also interacted with staff members in their time off from work during lunch and tea breaks to get a sense of staff members’ lives outside of work, especially their interactions with services like WhatsApp and Facebook on their smartphones.
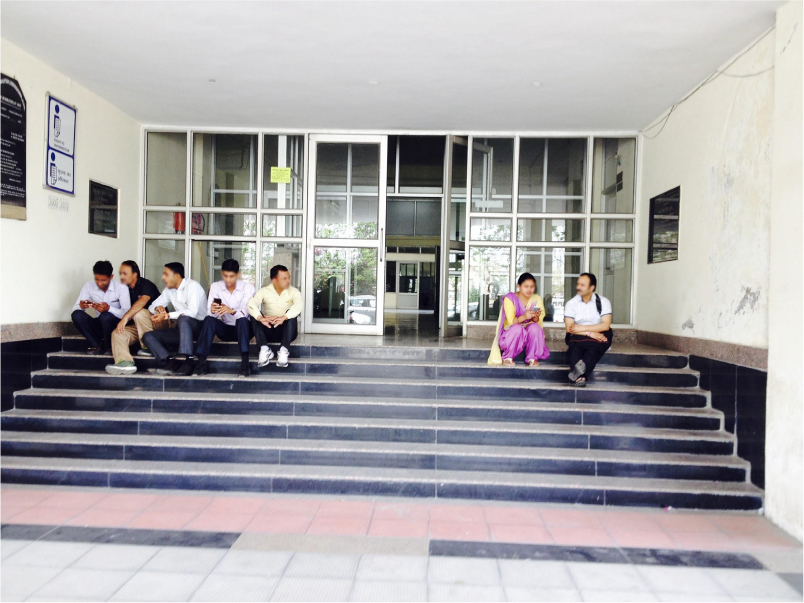
Figure 4 Staff members taking a few minutes off after lunch before heading back to work.
Such interactions allowed the Fellows to gauge staff members’ familiarity with smartphone devices and their use of technology for digital leisure activities (Arora and Rangaswamy 2013). Combining data from interviews taken in formal work settings with data from participant observation during lunch breaks, and tea breaks, the Fellows were able to develop a more complete picture of various staff members’ digital skills capacity and their perceived/projected relationship to technology and specifically their opinions about the accuracy of data in MIS, its utility, its intended/hidden usages etc.
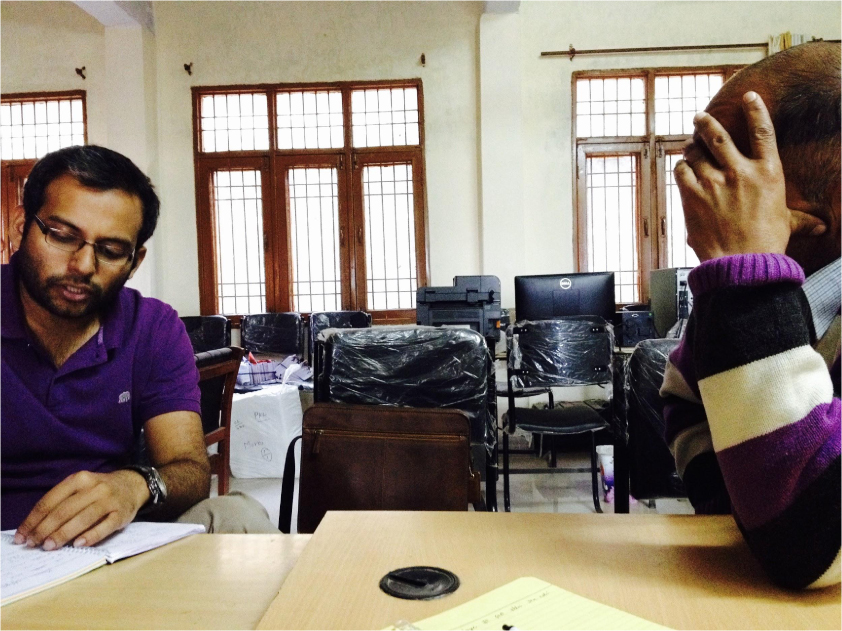
Figure 5 Understanding data requests from the block office during an interview
The Fellows started working with the computer operators in the branches and took up their tasks in order to understand daily data requests, expectations from their superiors and how these operators collect data. Correspondingly, they conducted such participant observation activities in field offices as well. They sampled 8 block offices across 3 districts and 2 district offices using data quality numbers from a separate yearly data exercise called the U-DISE survey18. They travelled and spent from few hours to up to 2 days at each of the offices in order to understand how data is used in the everyday life of the staff at field offices of the Department. During their conversations with the staff, they focused on identifying their data needs on a daily, weekly, monthly, half-yearly and yearly basis to develop a sense of data requirements over time and frequency. Second, they focused on the specific formats19 in which data is required within the Department and the decisions that they have to take based on such data.
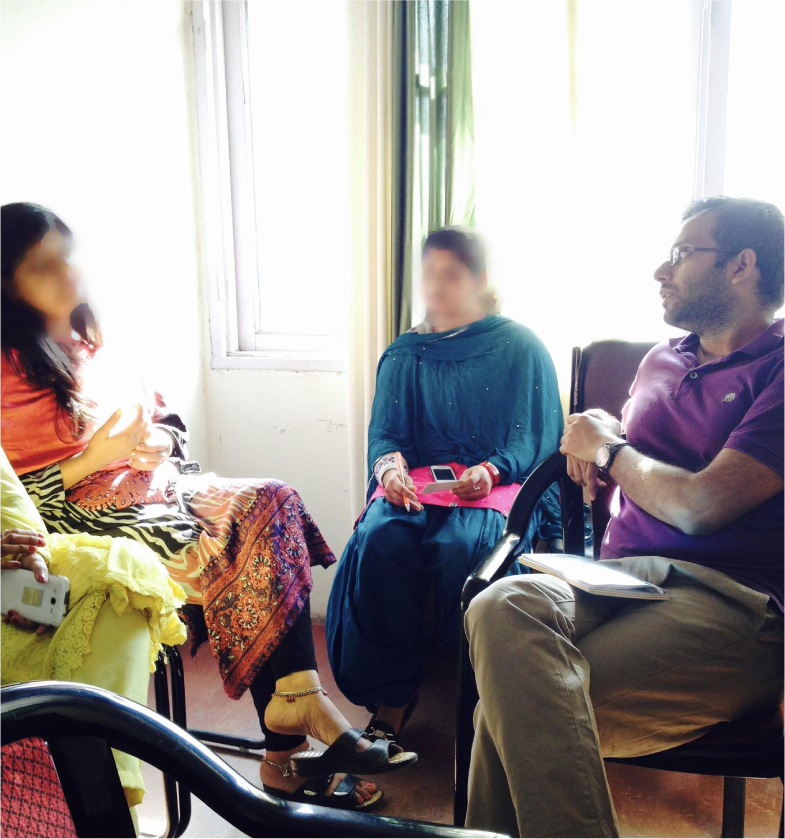
Figure 6 Conducting Focus Group Discussion with MIS coordinators in a block office
During the two months that the Fellows spent understanding the work of the Department and it’s several projects under the Quality Improvement Program (QIP) they made visits to various districts and conducted semi-structured and unstructured interviews with officers in the field. From this, they realized that lack of adoption could be explained as a consequence of several factors. While on the one hand the MIS was still in development and not all of its modules and reports had become fully functional, on the other hand the MIS reports interface was not amenable to easy and quick use in addition to absence of certain key reports. Where reports were available they were not available in the required tabular formats.
The introduction of the MIS was a major technological intervention as a result of which many processes in the Department were undergoing changes. These changes had created anxieties in the Department staff of an unknown consequence of using the MIS. And some of these anxieties were legitimate as can be shown by the following reflection by a branch superintendent:
“…Two reports about the same statistic give us different numbers. Count of number of students changes depending on which reports we download. We cannot work with such uncertainty. I don’t think the MIS has accurate data. I would rather call up people down the hierarchy and seek numbers from the schools…”
Murthy and Mani identify the following reasons for low technology adoption: technological complexity, technology fatigue, level of complexity or the switching cost (Murthy and Mani 2013). In a similar vein, trying to understand why staff members did not want to adopt the MIS, the Fellows found that it was not clear to the staff if the MIS really assisted them in their daily tasks. It was found that all of these factors contributed in part leading to low adoption of MIS in the Department. Neither did the headquarter staff use the MIS for their day-to-day data needs, nor was field staff completing data in the MIS portal. Some of the observations collected include:
- The MIS was being rolled out in phases20. Phase one focused on launching student and school services e.g. admissions modules, school infrastructure data etc. Phase two focused on launching employee services while phase three aimed at incorporating welfare scheme modules and employee HR policies into the MIS. Student and school data was available but employee data was still being collected. The branches wanted to be able to access all of their data through a single system. However, the MIS hadn’t become the single source of data yet. In such a situation, staff didn’t want to simultaneously pull data from the legacy database and the new MIS. Instead they preferred to continue using only the legacy databases despite those databases not having accurate data.
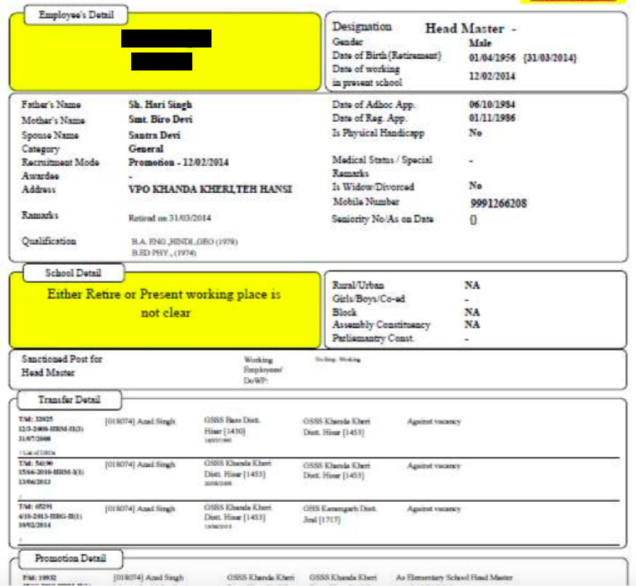
Figure 7 The Department relied on several disconnected systems each holding data in a disparate manner. Many times the data would be outdated.
- The existing reports contained data that was useful for decision making but did not adhere to formats used in the Department.
- Despite the MIS having a considerable number of checks, the system still had data quality issues. Branch computer operators showed certain anxiety about missing data. Even where data was complete, it was perceived by staff to be unreliable. The Fellows verified these claims by looking at various reports. During discussions with the Chief Engineer about discrepancies in different reports, it was found that the reports did not have wrong numbers but due to infrastructure constraints, they were being updated at different times of the day. Due to this, some reports had previous day’s data as compared to the others which were up-to date. This technological minutiae had not been communicated to the users which added to the mistrust of MIS system among the Department staff.
- Organizational inertia prevented the Department from changing operational processes so drastically in such short period of time
- Court cases, RTI requests and routine work were taking up so much time that Computer Operators felt overburdened by the extra time it takes to learn a new system.
The Fellows found that alleviating anxieties would be key to the organizational shift required for MIS adoption. These anxieties were certainly not baseless. There had been incidents where the MIS had inaccurate data about a particular school in a specific block of a district. The MIS had not been able to capture some critical information. For example, information about whether a school was rural or urban was missing for more than 50% of the schools as of March 2016. This information was critical for many Department staff responsible sending welfare aid to schools as rural and urban schools received different kinds of funds. Because of this, anxiety regarding MIS usage persisted. The Department wanted to increase adoption of the select number of reports that were already available but the staff was not ready to start using a system that only partially met their needs.
In the post-colonial bureaucracy that India is, official government files are the media through which government communication and decision-making happens (Raman 2012). The legacy online systems that the Department’s branches used have matured to a certain level (despite their shortcomings), such that they fit the bureaucratic system of file and paperwork of the Department, whereas the MIS did not. And thus every time the Fellows broached the topic of moving from using the existing systems to the MIS, they were met with various excuses revolving around how the MIS did not provide data in the appropriate form despite it being accurate and up-to date21.
The Department does not work in a silo disconnected from the bureaucratic maze of the broader Government of Haryana and the Government of India’s expectations of report formats and data formats. In such a scenario, the Fellows found that while a few computer operators in the Department were willing to use the MIS for their routine work, the broader bureaucracy still expected reports in certain formats as a result of which operators fell back onto using the legacy systems all over again. The MIS reports were not useful and that they required MIS operators to invest time in correcting the formats of the exported MS Excel sheets. A staff member in one of the block office said:
“…We are expected to give the same reports in different formats. Sometimes the change in format is mere rearrangement of columns from the earlier report. To reduce our work, whatever requests we get from the headquarter we pass it to the field offices and get the reports in the required format…”
RESULTS
The IIC Fellows spent close to two months conducting interviews, field visits to various offices and participating in various office activities in the Department. Such immersive participation allowed the Fellows to build relationships with staff members who became helpful interlocutors and supporters over time. Using insights developed from the field work, the Fellows found out that MIS adoption was not a problem in isolation. It was not that the technology was built, infrastructure was laid out and everything was set up but the people did not want to use the technology like in case of Aramis in Paris, France in the 1980s (Latour 1996). The problem was a result of multiple interconnected factors affecting the situation with the root of the problem being an incomplete understanding of the user of the MIS. The MIS was being built in phases and only few phases had been rolled out when the Fellows started their work. All modules needed were not available to the users. Within the modules that were rolled out, data in many fields was incomplete (some of which were important to make key decisions). Most importantly, data in the MIS reports was not in the right format. When not available in the intended format, the data was of no use to the Department and hence was rejected. Formatting the spreadsheets to adhere to the required format would not have been hard, but given the low level of digital literacy in the Department, very few staff members could manipulate the reports. This created extra work for the staff and thus no one used the MIS reports. This frustration can be seen in the following sentiment of a District Education Officer:
“…All our data needs are not fulfilled by the MIS. In such a scenario we have to call schools and when we are calling them we might as well get everything from the Headmasters [instead of getting half information from MIS and other half from schools]…”
Any IT system takes time to stabilize. Issues are fixed over time. Similarly, data quality is usually low in the beginning and quality improves over time as more and more data is used. Inaccuracies in data, are subsequently corrected. While such understanding is common among the IT professionals, the Department staff, new to the MIS, expected data to be 100% accurate from the get go and thus even a minor error in data would become a red flag for the staff members and a reason to stop using the MIS reports. On top of actual data quality concerns, even when there was good quality data for a certain metric, the Fellows found that the staff did not want to trust the MIS data. For example, even when the consulting organization working in partnership with the IIC Fellows had verified the number of students across the state, many staff members in the Department did not believe that the numbers were what they were. Most staff members that the Fellows spoke to alluded to the system logic being incorrect. A Program Manager at [ABC] branch had the following to say regarding the same:
“…I do not think that the number of students in the state has actually gone down. I do not believe what the [XYZ] has to say about fake student records being purged from the databases. The system just made a lot of kids invisible just because they do not have one or the other document to legitimize their claim [to get free education]…”
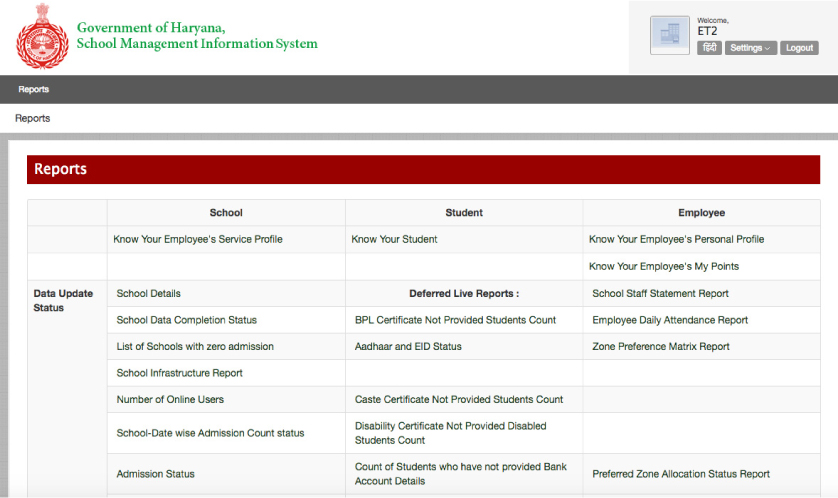
Figure 8 MIS reports home page
A non-intuitive user interface did not help the MIS’s cause either. The reports homepage is essentially a list of all possible spread sheets that a user can download off the MIS portal without any logical organization. During participant observation activities it was noted that the staff members found it hard to spot the report they were looking for. They found that reports on just student or employee entity were of limited use to the staff members. Staff needed reports which synthesized information from syudent, employee and school databases. A Computer Operator mentioned, “…I would like to enter school code into this system and get information on a particular school’s staff strength, student strength as well as infrastructure information. The MIS reports only give me either student data or school infrastructure data…”
In order to improve the user experience the Fellows worked with a focus group and came up with alternative reports homepage layout. Upon pursuasion by the Fellows, while the Department recognized the need for a re-design of the reports dashboard, it put this task at a low priority. Adopting a system still being built is a tough task. When the full system is not available for use and all the data requirements are not met by a newer system, there is not enough incentive for users to use the newer system, when older system are still able to accomplish their tasks despite there being issues with the older systems. For example, most legacy systems in place at the Department were updated at a very slow speed while the MIS provided the staff with near real time data. It was simply the incomplete data that prevented user from adopting it.
While interviewing the field staff, the Fellows found that even though the designers of the MIS provided more information about schools, students and teachers than required, it didn’t serve the need of end users. On multiple occasions the change in format was only a rearrangement of columns from previous reports. The officers looking at the reports didn’t have time and motivation to do this rearrangement and hence the work was given to operators. The findings showed that a simple custom report generator would have served the purpose. As one computer operator puts it, “…if we can get the flexibility to pick and choose columns before downloading the excel, it would be helpful and reduce our workload…”22
The most important attribute that the Quality Improvement Program (QIP) was missing in it’s design was a workstream for building digital capacity in the Department staff at various levels. The Fellows found that digital literacy skills of the Department staff including senior officers, was at the low end of the digital skills spectrum. But the bureaucratic norms in the government allowed top officers to delegate all of their digital work onto subordinates without being reprimanded for not knowing how to check their email or compose a word document on their own. There is a distinct symbolic economy at play here. The public services in India have a colonial past in that they are a postcolonial extension of the British Indian Civil Services wherein the British administrators took high offices while Indian people worked as subordinates in the same offices (Raman 2012). Bhavani Raman has explained the functioning of the scribe during the days of the British East India Company in India (2012). After working within the indian bureaucracy, the Fellows noticed that while a lot of the cultural dispensation has changed, it is remarkable that the division of labour described by Raman still persists among the senior officer and their subordinates. This is so embedded in how the civil services operate that even when an officer is competent to check email, compose Microsoft (MS) Word documents on their own, they will have the stenographers/computer operators to do this work for them. Even though the British government does not rule India anymore, the consequences of the hierarchy they created still present themselves in the bureaucratic system today. Most notable is the continued existence of the job position of the scribe. Scribes transformed into stenographers or typists and later into computer operators over time but the position in the heirarchy responsible for typing up documents on behalf of the senior officers continue. Understanding of the history of the Indian bureuacracy is crucial in creating useful IT systems for the Indian government. When the senior bureaucrats discussed their subordinates’ competency in MS Word, MS Excel etc, they cited tendency to not work. They highlighted how the same people enthusiastically adopt Facebook and WhatsApp, without taking into account the extremely easy to use interfaces of the various social media services. The Fellows found that many senior staff members in the Department did not even know how to turn on a computer. They relied on computer operators allotted to them to do the bulk of the digital labour involved in composing files and other related work.
After having arrived at a complex problem formulation using ethnographic research, the Fellows devised next steps in the following manner:
- Suggested a Custom Report Generator to be built that allows users to choose what data columns they can select in the exported reports
- Suggested changes to the User Interface of the reports homepage
- Suggested changes to the report design by employing tidy data concepts (Wickham 2014)
- Convinced the Department that lack of digital skills among the staff members and conducted comprehensive digital literacy training for all staff members in the Department
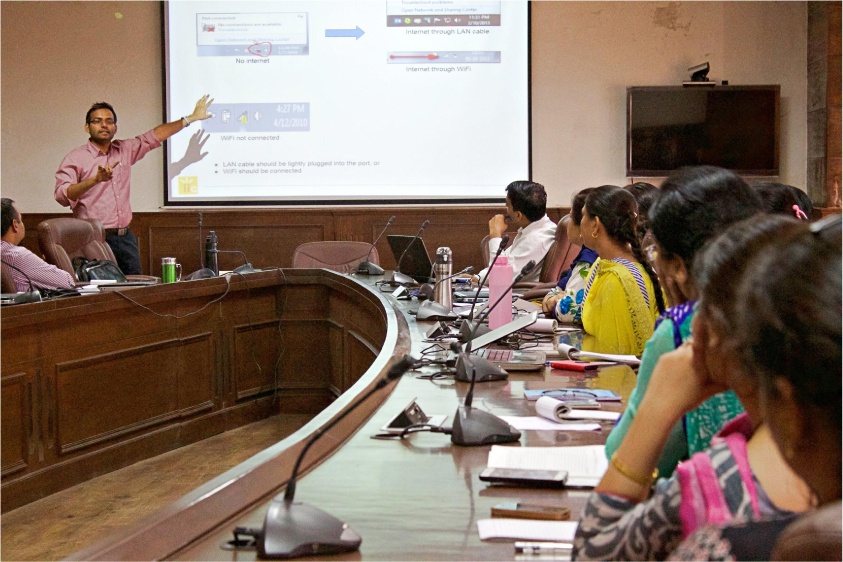
Figure 9 A Digital Literacy workshop in progress
Richard Saumarez-Smith has outlined how British administration of India in the 19th century gradually became a rule by records and a rule by reports- and reports in a very specific format (Smith 1985). Many people who have worked with the Indian bureaucracy may be able to relate with the stringency of reports and document formats expected by the bureaucracy. In going through paper-based and digital reports the Fellows realized that while the Department wants to move to an online workflow, it cannot abruptly abandon the paper-based processes to communicate information since in the medium term, most of the work is still going to be paper-based. Thus, when the Department is moving online, it is continuing with the formats it has abided by for years on paper, which do not always make the best use of data organization format that tools like MS Excel can provide.
Additionally, by uploading reports in the formats that they used to be on paper, they have done away with any learning curve regards to learning data analysis using MS Excel that would come with using the new reports. Because there is no learning curve, the staff feel that these are the same as the older reports but without the efficacy of the older ones because of various reasons and thus do not want to use them.
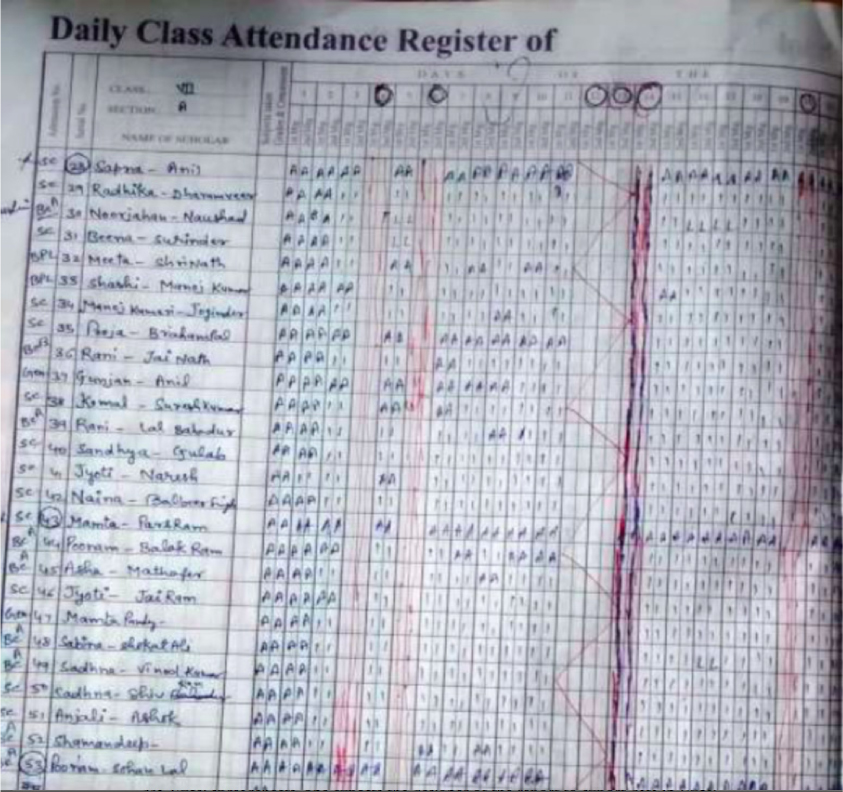
Figure 10 This paper-based report captures the daily attendance of a student on a particular class.
As one can observe in the above picture, paper medium allows for flexibility of annotations and several other freedoms to inscribe paper based documents in multiple ways. When such a report is moved to MS Excel spreadsheets, one expects the designer of the report to export data in Excel such that the data analyst can use MS Excel’s features and easily make various analyses using pivot charts, tables etc. However, data exports in the MIS did not seem to follow this logic.
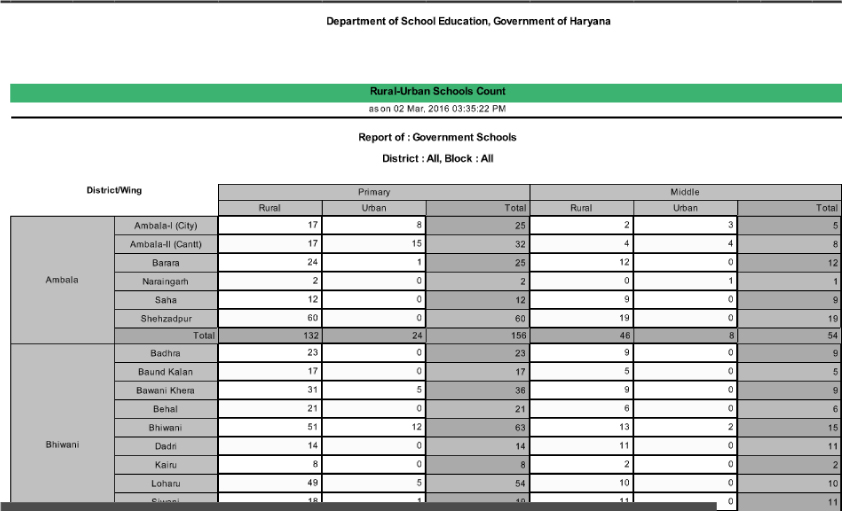
Figure 11 Partial screenshot of MIS report on government schools in Haryana
In Figure 11, one can see that the software developers have put in so much effort to code the data exports such that MIS users can directly use the reports without being expected to conduct any MS Excel manoeuvre. This attitude underestimated the capacity of the users to learn new skills, such as using Pivot Tables on the original data to obtain similar results. By assuming that the users need everything pre-processed for them, the Department was losing an opportunity to actually build digital skills in the organization, skills which would not only help employees further their careers but also help the Department in developing a data driven organization. By using the concept of tidy data, engaging with the business analysts as well as the Department staff and explaining to them how MS Excel sheet data could be reorganized from scratch, the Fellows tried to convince the Department to either organize data needed in a particular manner for it to be really usable for the Department, or institute a massive digital skills training programme to continuously support the staff in their daily routine work. Unfortunately, the Fellows were not able to convince the Department to make changes to the MIS reports, but were able to convince them about the need for a comprehensive digital skills training programme. This programme was later piloted with a set of approximately 100 employees. In the training feedback, one of the participants wrote,”…the training was very helpful for my daily work. Things like Mail Merge will save a lot of crucial time. Formatting was always a problem [for me], now after learning so many new techniques my work will become easy…”
Based on positive feedback from the pilot, the Fellows ensured that this pilot was developed into an institutional training program. The officer in charge of one division in the Department passed a Government Order stipulating Digital Skills building workshops to be held for staff members every two months. The Order made attendance in these workshops mandatory for all staff members. The division has already planned workshops between September 2016 and July 2017. By focusing on basic digital literacy and enabling broader computer and internet usage in the Department, these trainings will create the prerequisite conditions for MIS adoption and support the Department’s larger e-Governance agenda.
CONCLUSION
The Internet has long become an appropriate technology for conducting development work in the global south (Mazzarella 2010). Government organizations adopting large scale IT projects risk subjecting themselves and their beneficiaries to steep learning curves if the systems are not user friendly enough. In this case, the IIC Fellows found that the government was being too wary of this steep learning curve. As a result of this concern, the Department reduced the learning curve so much that it became flat. The MIS entailed a basic replication of paper based reports to the computer screen without any modification to the organization of data so that the reports would become suitable for online/digital tool based analysis. Thus, even when the reports were being downloaded from the MIS, their representation was so close to the reports on paper, no staff member wanted to use the reports. These reports would have been useful if the Department still used paper as the media technology of preference, but in MS Excel workbooks, these reports and data made little sense. To address the issue, the IIC Fellows made suggestions to the Department regarding reports designs such that the reports once downloaded are suitable for analysis, as per user needs. Simultaneously, the Fellows conducted Digital Literacy training for the Department which equipped the staff to do that analysis. This increased the adoption in select branches where the Fellows had spent time. However, as soon as Fellows withdrew continuous support, adoption decreased correspondingly. In the meanwhile, the Digital Literacy training was made an integral part of the Department’s skill building program. It is hoped that the Digital Literacy program will help build capacity in the organization.
EXHIBITS
Exhibit 1: % Children in grade 5 who can do division, by school. 2007-201423
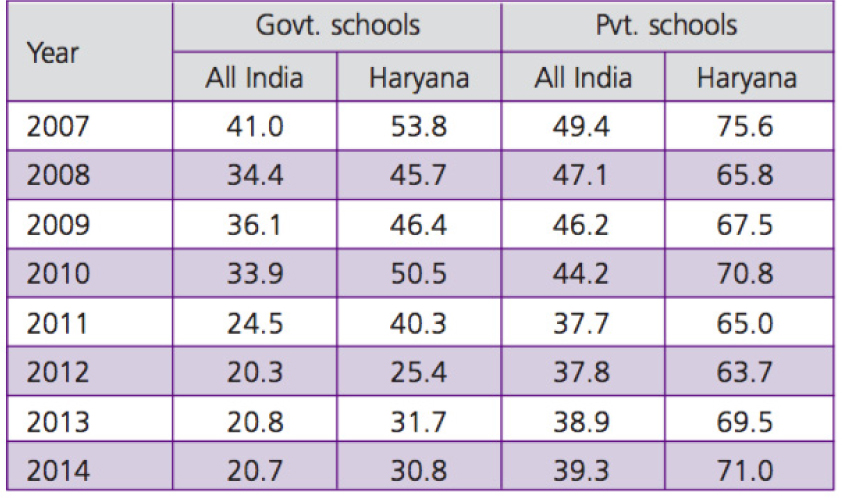
Exhibit 2: % Children age 6-14 enrolled in private schools, by gender. 2006-201424
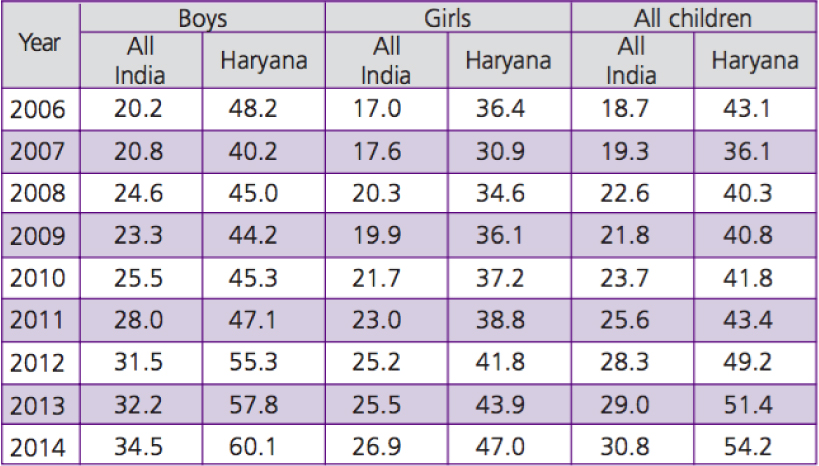
Exhibit 3: International Innovation Corps and the Michael and Susan Dell Foundation
International Innovation Corps (IIC)
The IIC recruits top-performing graduates of leading host-country universities and the University of Chicago and organizes them into teams of up to 5 Fellows. Fellows are trained for 5 weeks in skills required to translate their academic and professional knowledge into on-the-ground contributions. The IIC embeds each team within a government office to work on an innovative development project with a discrete, tractable scope for a year. The IIC provides light-touch managers and mentors to help teams of Fellows achieve their projects’ goals.
The IIC’s distinct model leverages global talent and government resources in a new way. This model has three defining features:
- IIC Fellows work in teams to foster entrepreneurial collaboration.
- IIC teams work directly with the government, to ensure projects address official priorities.
- IIC projects create scalable solutions, in order to maximize impact.
For more information on the program, please visit http://iic.uchicago.edu
The Michael and Susan Dell Foundation (MSDF)
MSDF is the family foundation of Michael and Susan Dell of Dell Computer Corp. MSDF supports multifaceted large-scale school system transformation with the potential to drive systemic improvements throughout schools and city wide school systems. To achieve these goals, MSDF partners with non-governmental organizations, governments, entrepreneurs and others and employ a variety of financial tools, including grants, equity. MSDF has supported integrated school excellence programs like the Mumbai School Excellence Program. They are now working on the largest and first-of-its-kind statewide transformation project focused on learning outcomes in Haryana state in India. Additionally, they are supporting the Government in mandated in-class continuous and comprehensive evaluation (CCE) across four states in India. For more information please visit http://msdf.org/india
Aakash Solanki is an Innovation Fellow to the Government of Haryana, India. He has a Master of Arts in the Social Sciences from the University of Chicago with focus on anthropology and history and a Bachelor of Technology in Information and Communication Technology from the Dhirubhai Ambani Institute of Information and Communication Technology.
Sarvesh Tewari is an Innovation Fellow to the Government of Haryana, India. He has a Master of Arts in Social Entrepreneurship from the Tata Institute of Social Sciences and a Bachelor of Technology in Computer Science from Uttar Pradesh Technological University. Before Haryana, Sarvesh has worked as a software engineer, business developer & a social entrepreneur.
NOTES
Acknowledgements – This case study is partially based on work conducted by the authors during their time as International Innovation Corps Fellows at the Department of School Education, Government of Haryana. The authors would like to thank the International Innovation Corps Fellowship team and Michael and Susan Dell Foundation (MSDF), for their support through out the fellowship year. The authors would like to also thank their friends, a coterie of reviewers who helped them with early drafts of the case. The ideas expressed in this case study do not represent the official views of the University of Chicago, International Innovation Corps, Michael and Susan Dell Foundation (MSDF), or the Government of Haryana. These views are solely of the authors.
1. It must be noted that “Digital India” is a rebranding of existing programs i.e National e-Governance Plan, National Optical Fibre Network among others. Such programs have been running in India since the 1990s.
2. The International Innovation Corps (IIC) is program based at the University of Chicago Harris School of Public Policy, sends top talent to work with government organizations on a year long fellowships that implement innovative solutions to important development problems. For more details, refer to Exhibit 3
3. http://www.digitalindia.gov.in/content/vision-and-vision-areas
4. http://ndlm.in/overview-of-ndlm.html
5. This figure changes frequently as student enroll and unenroll in government schools at a high rate
6. http://ssaharyana.etenders.in/tnduploads/ssa/pressnotices/prsn24.pdf
7. Refer Exhibit 1
8. Refer Exhibit 2
9. The learning level outcomes of children in government schools of Haryana has been low as compared to other states with comparable economic prosperity (http://img.asercentre.org/docs/Publications/ASER%20Reports/ASER%20TOT/State%20pages%20English/haryana.pdf).
10. The Right of Children to Free and Compulsory Education Act or Right to Education Act (RTE) is a Constitutional Act in India that makes it mandatory for the State to provide free and compulsory education to all children in the age group of 6-14 years (http://mhrd.gov.in/rte). The RTE mandates each school to maintain a pupil to teacher ratio (Pupil Teacher Ratio (PTR)) of 30:1
11. The Indian welfare state classifies school going children based class, caste and religion and provides special assistance to children of disadvantaged backgrounds
12. Refer to Exhibit 3
13. Quoted from initial mandate of the project description for IIC Fellows
14. District is an administrative division one level below states in India. Haryana has 21 districts. Each district is further divided into several blocks.
15. A branch is essentially a team working towards a particular function. For example, the Mid-day Meal branch is tasked to manage disbursal of budgets to schools for food under the Mid-day Meal scheme.
16. Computer operators act as computer support personnel who type documents on behalf of Branch Superintendents and Branch Assistants in the Department. Superintendents and Assistants do not generally operate any computer device but are well versed with the bureaucracy while the computer operators are typically young professionals who have considerable proficiency with office software and on few occasions programming skills as well.
17. System Study Report is a document for the software development team prepared by the Business Analyst after studying client system workflows and understanding their requirements.
18. U-DISE (Unified District Information System for Education) is a database of information about schools in India. See http://www.dise.in/udise.html. While U-DISE itself is marred with data inaccuracies, the Fellows could not find a better alternative to it and thus, went ahead and chose their field sites as per U-DISE data quality numbers.
19. Format here means, a particular tabular structure in which the data needed to be presented such that it was useful for the department
20. This method changed in the last quarter of 2015 when a new Principal Secretary took over. Principal Secretary is the head of the department in the bureaucracy.
21. It must however be noted that general lethargy in adopting a new system was also a factor throughout
22. Translated from Hindi to English by authors
23. http://img.asercentre.org/docs/Publications/ASER%20Reports/ASER%20TOT/State%20pages%20English/haryana.pdf
24. http://img.asercentre.org/docs/Publications/ASER%20Reports/ASER%20TOT/State%20pages%20English/haryana.pdf
REFERENCES CITED
Arora, Payal, and Nimmi Rangaswamy
2013 Digital Leisure for Development: Reframing New Media Practice in the Global South. Media, Culture & Society 35(7): 898–905.
Benjamin, Solomon, R Bhuvaneshwari, P Rajan, and Manjunath
2007 Bhoomi: “E-Governance”, Or, An Anti-Politics Machine Necessary to Globalize Bangalore? https://casumm.files.wordpress.com/2008/09/bhoomi-e-governance.pdf.
Geertz, Clifford
1977 The Interpretation Of Cultures. New York: Basic Books.
Latour, Bruno
1996 Aramis, or, The love of technology. Cambridge, Mass.: Harvard University Press.
Mazzarella, William
2010 Beautiful Balloon: The Digital Divide and the Charisma of New Media in India. American Ethnologist 37(4): 783–804.
Murthy, Sudhir Rama, and Monto Mani
2013 Discerning Rejection of Technology. SAGE Open 3(2): 2158244013485248.
Raman, Bhavani
2012 Document Raj: Writing and Scribes in Early Colonial South India. Chicago [u.a.]: Univ. of Chicago Press.
Smith, Richard Saumarez
1985 Rule-by-Records and Rule-by-Reports: Complementary Aspects of the British Imperial Rule of Law. Contributions to Indian Sociology 19(1): 153–176.
Sreekumar, T. T.
2007 Decrypting E-Governance: Narratives, Power Play and Participation in the Gyandoot Intranet. The Electronic Journal of Information Systems in Developing Countries 32(0). http://www.ejisdc.org/ojs2/index.php/ejisdc/article/view/465, accessed February 24, 2016.
Wickham, Hadley
2014 Tidy Data. Journal of Statistical Software 59(10). http://www.jstatsoft.org/v59/i10/, accessed July 25, 2016.