
Case Study—This case-study details how a team of anthropologists and a team of data scientists sought to help a Middle Eastern theme park make use of their big data platform to measure ‘the good customer experience’. Ethnographic research within the theme park revealed that visitors yearned to bond with the other members of their group, as they rarely got the chance during their busy everyday lives back home. However, trying to build a measurement of how the theme park delivered on bonding – through the development of a ‘bonding index’ – turned out to be unfeasible, because the big data platform focused on capturing operational data. The decision to focus on operational data had unintentionally created a path dependency that made the big data setup unfit for answering some of the theme park’s most fundamental questions. This is a problem ReD Associates has observed across clients and to solve it this paper suggests that companies start with an open-ended, ethnographic study of their big data needs before they build a big data platform. This will enable companies to be more strategic about their digitalization and thus maximize its impact.
THEME PARKS ARE AN ELDORADO FOR DATA SCIENTISTS
“If you want to imagine how the world will look in just a few years (…) skip Silicon Valley and book a ticket to Orlando. Go to Disney World.”
– Wired, 2015
Imagine a young girl called Liza going to Disney World for the first time in her life. She spots Pluto, her all-time favourite Disney character, and, as she walks toward him, he gets down on his knees, stretches out his arms readying them for a hug and calls out her name: “Liiiiza!”. Pluto knows her name – but how could he?
The MagicBand Liza, and most other guests at Disney World Orland wear around their wrists enable the theme park to collect and make use of a wealth of data about their guests. Upon purchasing tickets, people will give up personal information like name, age, favourite character and credit card information. Inside the park this information can then be combined with geo-location data to provide someone like Pluto with the input he needs to create a special moment for kids like Liza. A truly magical Disney-experience – enabled by big data.
Pluto, and other characters calling out the actual names of kids (and possibly adult fans too) visiting Disney World is one use-case out of several imagined by the people behind the MagicBand. It is still in development, but families can already now be greeted by name before even opening their mouths when approaching a restaurant they’ve booked a table at. Another use-case, currently termed “The Story Engine”, plans to combine geo-location data with the park’s many video cameras (and possibly face-recognition software too) to create personalized videos for every single group visiting the park. Catching the candid moments and giving everyone a unique and shareable souvenir.
These moments of magic are enabled by a combination of a state-of-the-art big data setup, which reportedly cost Disney 1 billion USD to develop (Kuang: 2015), and a willingness to share personal data unparalleled by the outside world. This willingness to lay aside privacy concerns for a day of family-fun makes theme parks a unique fieldsite for both anthropologists and data scientists interested in what the future may hold at the intersection between big data and human experiences.
COMBINING THICK- & BIG DATA IN A THEME PARK
This case-study details the story of how another theme park, one placed in the Middle East, sought to utilize Big Data to improve its customer experience. The park, like Disney World, consisted of a closed space, where they owned all the restaurants (and their sales data), all the Wi-Fi routers (and their geo-location potential), all the rides (and their utilization data) and all the surveillance cameras – to name just a few data sources. To help improve the customer experience the park hired a team of anthropologists from the strategy consultancy ReD Associates in the summer of 2017. The team became a small part of a much larger ongoing project to build a Customer Data Platform (CDP). The theme parks executives hoped that the CDP could give them insights into how customers experienced their park and use it to guide strategic decisions going forward and to accurately measure the impact of new initiatives. The first roll-out of the CDP planned to collect data from 250 discrete data sources, which would then be stored in a Hadoop Data Lake. When the team of anthropologists joined the project 40 data scientists had already been on the ground at the theme park for three months, with a similar number working ad hoc remotely – primarily out of India. The anthropologists’ involvement was set to last 6 weeks, whereas the first roll-out of the CDP was set to last a year followed by a support and adjustment phase.
At the onset of the project the division of labour for the collaboration between the anthropologists and data scientists was clear. The anthropologist would carry out an ethnographic study of the guests in order to identify what characterized a good user experience and the data scientists would then figure out how to measure that using big data analytics:
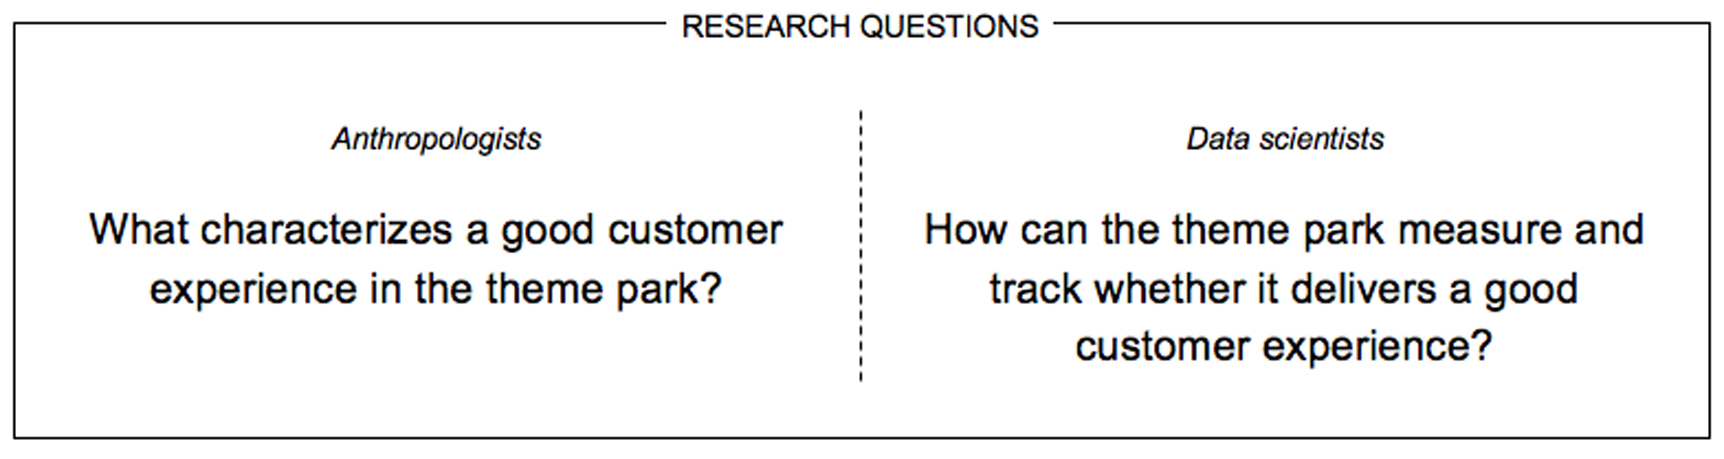
The idea was thus, that after the anthropologists found out what mattered to visitors, the data scientists would measure how it was delivered on and track it over time as the park sought to improve it.
Conceptually, this this type of collaboration between the anthropologists’ thick data (Geertz: 1973) and the data scientists’ big data can be described as a ‘Sounding Board Model’. The anthropologists job was to identify and “throw” insights at the CDP, which then, with the help of the data scientists, will return a quantified measure of the identified insight. One example, which the park executives and data scientists provided at the start of the project, illustrates how they imagined the collaboration:
- Queuing time: If the ethnographic research finds that queuing for rides is a major pain-point and something that is crucial to focus on in order to improve the customer experience, the CDP can be used to track queuing times and estimate the size of the problem. The effects of initiatives to alleviate the problem, such as e.g. guiding people towards less busy rides or planning shows during ride rush hours, can then be measured going forward.
This approach to integrating thick- and big data has the allure of seemingly being able to combine the two data types’ biggest strength while simultaneously countering each other’s biggest weakness, namely by adding scale to the thick data and depth to the big data (see Figure 1).
The Hadoop data lake, which was chosen as the type of big data setup for this theme park over the more traditional Data Warehouse setup, is well suited with the sounding board model of thick- and big data integration for two different reasons.
Firstly, a Hadoop data lake can store data at a fraction of the price compared to data warehouses. Whereas a terabyte of data stored in a data warehouse can cost $250,000 a terabyte stored in a Hadoop data lake can cost $2,500 – a reduction in price of 99% (PwC: 2014). This means that a larger ‘sounding board’ can be built with the same budget, thereby, in theory, making it possible to have enough data to quantify any insight the anthropologists might conjure up and throw at it. The drastic reduction in price can to a large extent be explained by the different data storage formats of data warehousing and data lakes. Whereas data warehousing requires a costly and time-consuming data integration and structuring up front, a data lake will store data in its native format – i.e. raw and unprocessed data, which can then be ‘fished’ out of the data lake when needed.
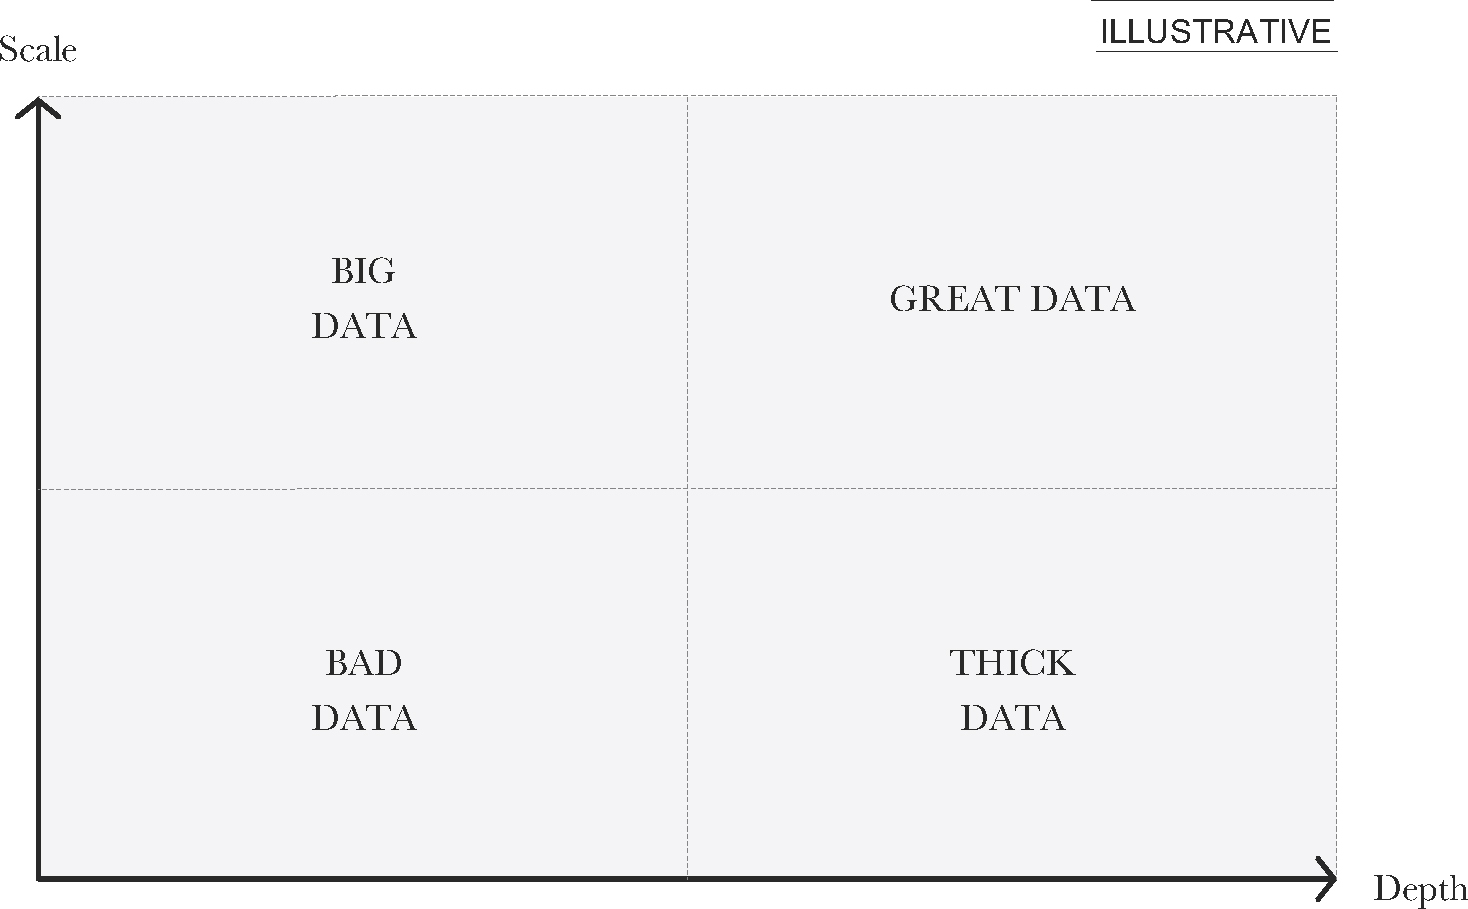
Figure 1: Illustrates how the combination of thick- and big data can theoretically produce a new type of data that contains both depth and scale.
Secondly, the fact that the data is stored in a native and unstructured format means it lends itself well to flexible and task-oriented structuring (PwC: 2014). The anthropologists’ insights were thought to prompt this type of task-oriented structuring, which made the data lake setup well-suited for a sounding board type of collaboration. Or, to stay in the metaphor, the setup made it easy for the data scientists to go fish after the anthropologists have told them what to fish for.
ETHNOGRAPHIC RESEARCH APPROACH
The ethnographic fieldwork lasted just over two weeks during which the anthropologists would spend 1-2 days together with 12 different groups visiting the theme park. These groups were recruited to be approximately representative of the nationalities, age spread and group types – i.e. couples, families or groups of friends – that visit the theme park. A day of fieldwork would most often start with meeting the group visiting the park for breakfast and then stay with them until they arrived back at their hotel. The research would, when possible and appropriate, be documented using a dictaphone, a (waterproof) camera and a notebook. The anthropologist would go on rides with the groups or wait with part of the group as others went on rides, walk around the park with them, share meals with them, get lost in the park with them, and share motion sickness with them (especially the adults as they are more susceptible to this than kids and teenagers, see: CBS: 2015). The ethnographic research thus relied first and foremost on participant observation and on-the-go semi-structured interviews.
During fieldwork the team of anthropologists explored themes and research questions such as:
- What makes a good holiday?
- How does group dynamics impact the visit?
- What moods characterize peoples’ visit to the theme park?
- How does a visit to a theme park fit into a larger holiday itinerary?
- What were the steps leading up to a visit to the theme park?
- What were people expectations and how did they match their actual experience?
- Which rides were peoples’ favourite rides, and why?
- How do people share and recall their experience after their visit?
Following each day of fieldwork the researchers would write up their notes, upload them for the rest of the team to see and discuss.
THE SOCIAL STAKES ARE HIGH FOR HOLIDAYING
The analysis following fieldwork identified three key opportunity areas based on insights about what mattered most for improving the park’s customer experience. The insights behind each of the three opportunity areas are sought summarized below in one sentence each:
- GET CLOSER: Guests want to bond within their social group when visiting the park.
- GET BALANCE: Guests want more variation in the mood-spaces offered within the park.
- GET REAL: Guests want deeper and more authentic experiences with the park’s theme.
Of these three, the first opportunity area ‘GET CLOSER’ was found to be the most crucial and fundamental one to deliver on. For this reason, this was where the lion’s share of the collaboration between the anthropologists and data scientists would focus. The remainder of this case-study will focus solely on this opportunity area.
During fieldwork, the ethnographers collected many stories of people who felt disconnected from the other people in their group during their everyday back home. Some examples include:
- Lorenzo (60, Italy): He lives in Italy and is divorced from the mother of his 7-year-old son, who moved to Canada with their son after the divorce. Lorenzo rarely gets to see his son and spend time with him, and as a consequence fears that he will lose contact with him as he grows older.
- Rodrigo (28, Philippines): Lives and works in a city two hours drive away from the city where his fiancé lives and works. About two hours of transportation separates them and they only get to see each other on weekends – unless they have a work shift during the weekend, which is relatively often the case.
- Molly (39, Denmark): Is the mother of two rollercoaster-loving tweens. She fears that this holiday might be the last where her kids really want to spend time with her before they grow up and become more independent. The last real family holiday, as she describes it.
- Robert (46, Belgium): Is a successful surgeon, divorcee and father of two teenage sons. He feels that work makes his everyday too busy to really bond with his sons, only leaving 5-10 minute intervals to interact on most days back home, which makes it hard for him to really feel connected to his sons and vice versa.
What these stories illustrate is that many people visiting the park has a need for bonding that is not satisfied in their everyday life, which they often described as fragmented. A description that resonates with Zygmunt Bauman’s description of late modernity as liquid modernity (Bauman: 2000). Holidaying thus becomes a way for groups to seek out a social connection with their loved ones, which they struggle to feel in the everyday. And the stakes are very high. A study by two sociologists, associate professor Julie Brines and doctoral candidate Brian Serafini, found that divorce rates peak following winter and summer holiday seasons. The result of their research can be seen in the graph below (Brines & Serafini: 2016).
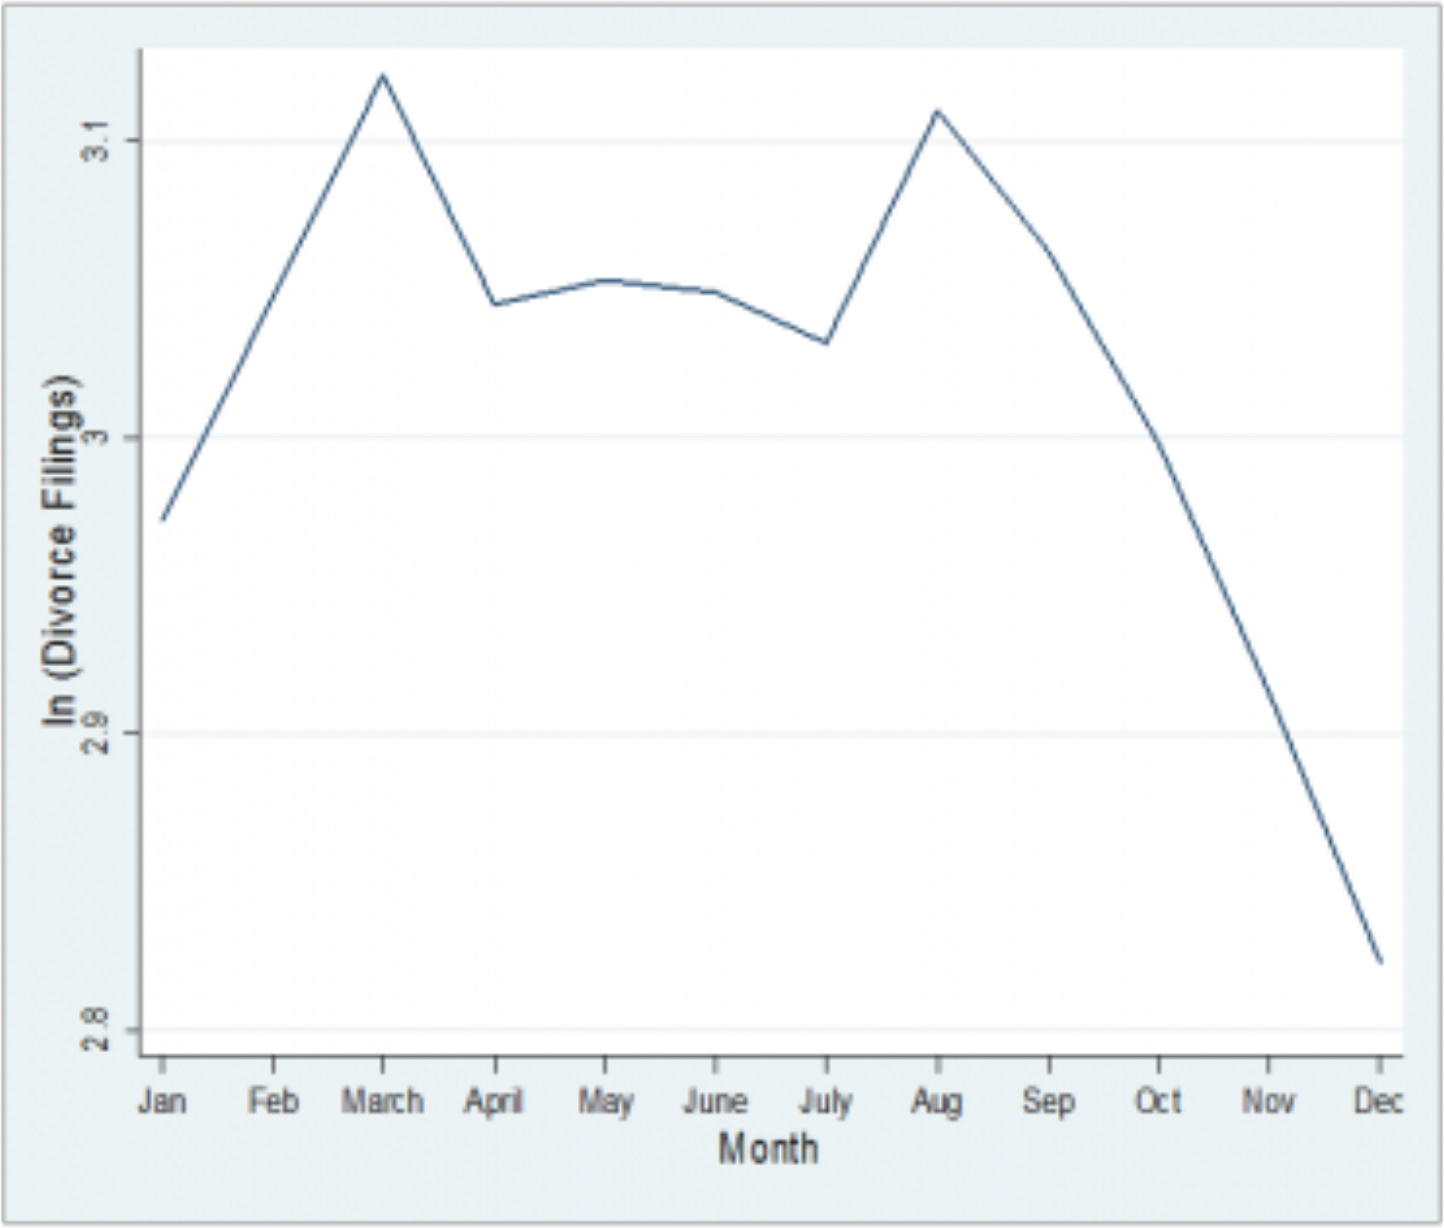
Figure 2: Illustrates divorce patterns in Washington state between 2001 and 2015 and shows that they spike after the winter and summer holiday seasons.
A visit to the theme park studied by the anthropologists should therefore not simply be understood as a destination for fun and thrills, but as a mean for facilitating the social bonding that groups don’t feel they can achieve in their everyday. However, when analysing the theme park through the lens of bonding it became clear that there were a number of areas that currently had a negative impact on the customer experience.
ASSESSMENT OF THE CURRENT BONDING PERFORMANCE
When analysing the theme park’s current performance through the lens of bonding, three distinct problems took shape.
Firstly, a lot of the rides and activities within the park create opportunities for competition between the members of the group. Upon finishing a ride, park visitors will get individual scores and a ranking so it’s clear who did best and how much better they did. This often had the consequence that the older or more experienced members of a group would continuously triumph over the younger or more inexperienced members throughout the park visit, which tended to create a divide rather than a bonding experience. One mother said, for example, when her son and husband were driving go-karts on a track with 8 other park visitors: “I hope he (her husband) doesn’t humiliate him (her son) too much.” This quote illustrates the flipside of the competitive focus of many of the rides within the park. The problem was most prevalent with families and couples, whereas with groups of friends the competitive element often added to the bonding experience.
A second problem related to the often varying levels of ‘theme park experience’ within groups. Theme parks are a rare or non-existent phenomenon in many places of the world, especially on the magnitude and degree of intensity of the theme park in question here, and many of the park’s visitors are not from the Western world. Rather, a large proportion of the park’s visitors were friends and families of immigrants who live and work in the country where the theme park is placed – a country were the native population only accounts for a minority of the overall population. While the local residents have ample choice of theme parks within the country, their guests have often never been to one before because it doesn’t exist in their home country. During fieldwork, the anthropologists observed how this difference in theme park experience within groups meant that some members of the group were left feeling like their boundaries had been overstepped while others felt disappointed for not being able to share the positive experience they got from the most thrilling rides with the rest of group. Both these sets of feelings were not conductive to a bonding experience.
A third problem with the park’s current performance on bonding related to group separation. Many groups would split up during the day. Often doing so intentionally to allow some members of the group go do something they enjoyed, but that the rest of the group did not – e.g. an intense rollercoaster ride. However, as they split up they often struggled to find each other afterwards and the narration of their separate experiences often feel flat. As a result the groups were often split up longer than intended and when re-united they struggled to share their separate experiences, which meant there was a lack of a shared narrative about the theme park experience.
RECOMMENDATIONS FOR IMPROVED IN-PARK BONDING
To address the three separate problems with bonding outlined above the team of anthropologists developed three different concepts.
To make competition more conductive to a bonding experience the team suggested a more social form of competition, where groups can compete together against other groups instead of with each other internally. This is aimed at creating an environment where the group tries to encourage and help out each other, which should support a bonding experience. A similar concept has been rolled out at a science museum in Copenhagen with great success (Experimentarium: 2018). Furthermore, the CDP should be able to always find some statistic that would make the group look good, as that is only a question of data granularity, e.g. “Best family from Jakarta (IDN) today!” or “Best mom (38) and daughter (12) combo this week!”
To better handle the differences in theme park experience, the team suggested to focus on helping the ‘rollercoaster rookies’ build up their ‘rollercoaster confidence’. This could be done by inquiring about previous theme park experience at point of purchase and then recommend a route through the park that could slowly build confidence. Rollercoasters could also have a tag on them, which clearly stated the intensity level to be expected – similar to what has been done in the theme park Cedar Point in Ohio, which has the slogan “the roller coaster capital of the world” (see fig. 3 below). Today, it can be very difficult to guess the intensity of many of the rides in the theme park, as the ride itself is often hidden from view.
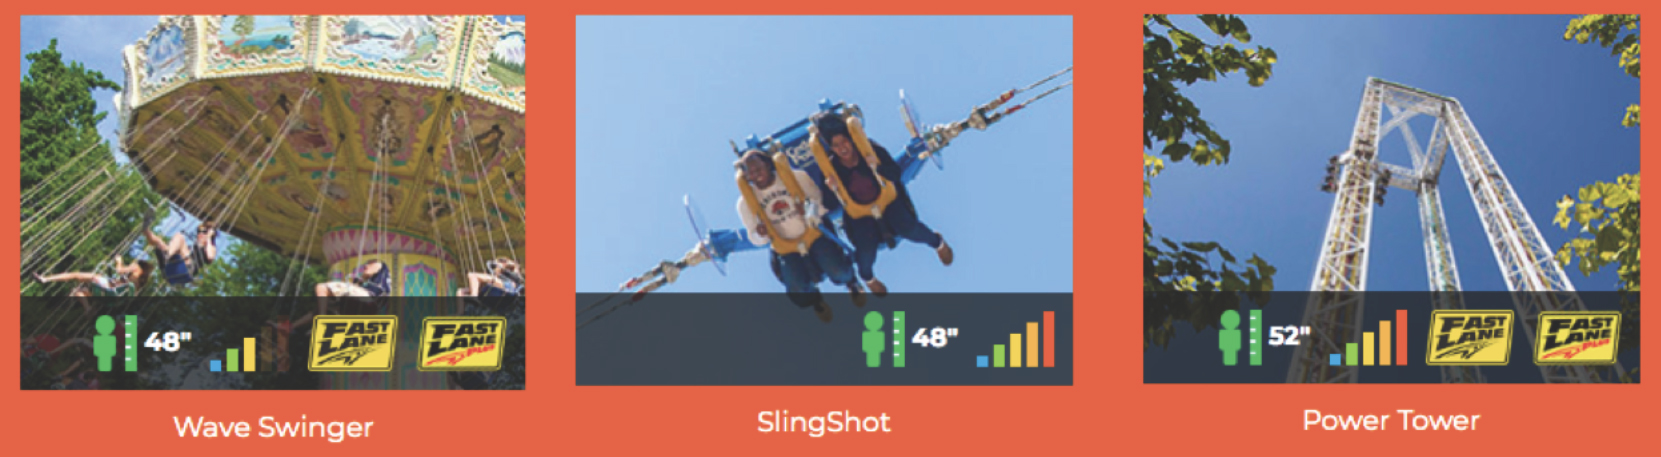
Figure 3: The theme park Cedar Point in Ohio clearly states the ‘thrill level’ of their rides, as illustrated with the 5 bars above (copied from Cedar Point’s webpage, September 8th, 2018).
And thirdly, to address issues related to group separation the anthropologists suggested to develop a system that would let groups easily locate other members of the group by utilizing the geo-location data. Furthermore, the anthropologists also imagined a solution, where the park could use data to help guests enhance the narration of their separate experiences – e.g. by sending information to the guests’ phones about other group-members experience such as speed, g-force, an action shot, heartrate or the vertical meters travelled on a roller coaster. This data could then be used when narrating one’s experiences to the rest of the group, thereby narrowing the distance felt between group members after they had been separated.
Combined, these three concepts should help the park deliver on guests’ social needs and change the focus away from the individual thrills, which had been the park’s focus up until this point. The insights along with the concepts were shared with the team of data scientists working on the CDP. The goal for the data scientists was then to suggest ways to quantify how the park delivered on bonding today and how it could be tracked over time. This should be captured in a ‘bonding index’.
The anthropologists’ insights had now been thrown at the data scientists’ sounding board, and the next meeting would reveal what the CDP would send back.
NO BONDING WITH THE BIG DATA
In a poorly lit, windowless room with a low ceiling the team of anthropologists sat down with a team of data scientists, to review the data scientists take on the bonding index. Following the anthropologists’ presentation of their insights about what constitutes a good customer experience in the theme park, the data scientist had gone back to the CDP to identify the most relevant data sources in the data lake. The result was a suggestion to build the bonding index based on the following 4 data sources:
- Revenue from group tickets: A group ticket being whenever 2 or more tickets are bought at the same time.
- Food & beverage sales to groups: Defined as whenever 2 menus or more are bought in the same transaction.
- Number of guests on competitive rides vs. non-competitive rides: With 6 rides within the park defined as competitive and all others as non-competitive.
- Number of guests on intense vs. relaxed rides: With a distinction between high-intensity (approx. 50% of total rides), medium-intensity (30%) and low-intensity (20%) rides.
Lorenzo trying to connect with the son he rarely sees. Rodrigo wanting to make the most of the precious time he has with his fiancé. Molly fearing her current holiday will be the last real family holiday. And Robert’s bi-annual (they also go skiing once a year) chance to connect with his teenage sons. Their unmet need for bonding in an age of liquid modernity had been boiled down into an index with the 4 KPIs described above.
The anthropologists’ first reaction was an emotional one dominated by feelings of disappointment and of being underwhelmed. This was not what they had expected of a multi-million-dollar data setup, of which they constituted only a small part. The second reaction was a more rational analysis of the 4 KPIs. The first KPI was problematic, as it depended more on the bundles sold by the park or travel agents and the composition of the groups, rather than the theme park’s ability to deliver a bonding experience. Furthermore, it turned out that almost 96% of current ticket purchases were already group tickets, which left insignificant room for measuring any meaningful changes. The second KPI was also problematic, as about 90% of meal purchases (which excludes sharable snacks such as popcorn) were already group purchases. Moreover, many groups of friends were likely to pay for their meals separately, unaffected by the park’s ability to deliver a good bonding experience. The third KPI was based on a misunderstanding. When the anthropologists had argued that there was a problem with the way competition worked within the park presently (as it often creates unintended divides within groups), the data scientists had assumed that this would then be reflected in fewer people using those rides. There were, however, few visitors who consciously reflected on the negative effect of competition and next to none that would avoid the competitive rides for this reason – especially considering that these rides were among the park’s biggest attractions. The unmet need leading the anthropologists to suggest social competition existed on a subconscious level and it was therefore not meaningful to assume that a significant amount of guests would actively avoid rides with a competitive element. Furthermore, the data scientists weren’t able to measure who went on what ride, only how many went on it. As some visitors, especially group of friends, were likely to enjoy the competition they could skew this data further – had it been meaningful in the first place. The fourth KPI shared many of the problems of the third KPI. The data scientists had assumed that the existence of rollercoaster rookies would lead to a lower utilization of the most intense rides. However, the rollercoaster lovers, who would go on the most intense rides again and again, would statistically hide the experience of the rollercoaster rookies, as the CDP wasn’t able to tell who went on what rides, only how many went on a given ride.
The meeting concluded with both teams agreeing to go back to the drawing board to assess whether it was possible to come up with a better bonding index.
LOOKING BELOW THE SURFACE OF THE DATA LAKE
The first thing the team of anthropologists did after the initial meeting was to take a thorough look at the 250 different data sources contained in the data lake. This was the first time the team of anthropologists had done so, as it had been viewed as the data scientists’ domain. The defined job of the anthropologists was to come up with a characterization of a good customer experience – not to decide what data sources should go into the CDP. However, the failure of the data scientists to come up with a meaningful bonding index prompted the anthropologists to take a first look below the surface of the data lake.
Here the anthropologists made two discoveries. Firstly, they realized that the vast majority of the data sources were operational in nature. The CDP would measure food and beverage sales, real-time inventory overview, number of ticket sales through different channels, how people clicked around the theme park’s website, the effect campaigns had on ticket sales, nationality and country of residence for people visiting the park (if they bought the ticket online), guest acquisition cost (measured as AED – Advertising Elasticity of Demand), YoY (Year Over Year) key sales data, real-time sales numbers compared to budgeted numbers, customer visit duration, ride utilization rates and downtime, average length of stay of employees and social media followers growth per market – to name just a few data sources. The CDP was geared towards capturing the park’s operational performance rather than data on the visitors’ experience, which limited the number of KPIs directly relevant for the anthropologists.
The second discovery the anthropologists made was that the CDP was not able to capture data on groups. The CDP had been set up to capture some data on individuals and a lot of data aggregated on a park-wide level, but no data on groups. It was, for example, able capture data on what an individual bought throughout their day within the park, but not who the person buying it were together with and whether these people also bought anything themselves. And it can measure utilization rates of all rides throughout the day, but not who goes on those rides (not even on an individual level). Not knowing what guests formed a group was, obviously, a big obstacle for trying to measure their internal bonding experience.
Having gone through the data sources making up the data lake the team of anthropologists realized that there was no quick fix to the bonding index, as the existing data sources were not suitable for accurately measuring bonding. The sounding board model for collaboration between anthropologists and data scientists, between thick data and big data, had failed. This realization came at a point in time when the anthropologists’ involvement in the project was nearing its end and there was no time to make amends within the scope of the current project.
During the last days of cooperation, the combined team of anthropologists and data scientists reviewed the data streams that the park executives were planning to include in future expansions of the CDP. Some of these data streams indicated that a meaningful measurement of bonding would likely be possible in the future, when the right data streams were in place. Some of these promising data streams included:
- Geo-location: The park was planning to introduce wristbands that, like the MagicBand at Disney World, would make it possible to track guests’ movement throughout the park. By banding together wristbands when groups entered the park it would be possible to track how groups, and the individuals within them, moved around the park. This would allow the CDP to capture data on e.g. what rides a group go on together, how long time a group spends in the park and what the group members do when/if they split up during the day.
- Point-of-purchase information: When guests are buying tickets from the theme park’s website, from a third party or at the gates, a future CDP planned to capture additional information, such as country of residence and group type. One use of this data could be to test whether the anthropologists’ claim that there’s a connection between country of residence and rollercoaster experience, as well as whether roller-coaster rookies will shorten their stay in the park if they try a too intense ride too early.
- Social media listening: A sentiment analysis of people’s comments, tags and photos on e.g. Facebook, Twitter and Instagram was also in the pipeline. One use of this data could be to track the impact it would have, if the park started providing guests with social competition scores instead of the individual scores it provides today. Would guests post more, post more positively and use words related to bonding more often, as a result?
- Survey review: The theme park routinely conduct surveys among guests exiting the park and were planning to update their questionnaire. Adding questions related to bonding might help illustrate the size of the problem and track the impact of future initiatives. Furthermore, cross-referencing customer satisfaction scores with geo-location data and ride scores might give insights into how e.g. a younger sibling vs. an older sibling experienced the rides centred on individualized competition.
The above illustrates that it might be possible to build a meaningful bonding index in the future, when the right data streams are in place. Getting these in place was, however, outside of the mandate of this project. And as of this writing, a year after the final report was delivered, a bonding index has not materialized. The central task for the anthropologists and data scientists’ collaboration thus fell flat. The remainder of this paper will deal with understanding the underlying reasons for why it failed in the hope that it can pave the for more fruitful collaborations in the future.
THE DETRIMENTAL EFFECT OF BIG DATA PATH DEPENDENCY
When evaluating the project, it became clear that the anthropologists spent the majority of their time on the project chasing a mirage. There were two reasons for this. Firstly, the current CDP included very little data on individuals and no data at all on groups. Capturing data on the customer experience, and not just the effect changes might have to the park’s performance, was thus a futile endeavour from the get-go. Secondly, the project did not have the mandate to define and suggest new data sources to be included in the CDP. This meant that the team could only work with the data sources included in the current CDP.
Before the data scientists made a bid for the project the theme park executives had written a request for proposal (RfP) detailing what sources they wanted to include in the CDP. These were made up of a mix between what data the theme park was already collecting, but would like to automate, and best-practice within the industry. The advantage of defining what data sources is needed upfront is that it lends itself well for comparison between different bidders: What is the difference in price? What are the strengths and weaknesses of their different approaches? Etc. The disadvantage is that a decision about what data to include is, to some extent, taken before knowing what data is needed. And once a contract has been signed, it is difficult to alter course. Thus, when the theme park executives signed the contract with the bidder they found most appealing, they also made a decision that meant it would be possible to measure the park’s operational performance but not the customer experience. This was not a deliberate decision, however, as they were unaware of the path dependency (Marquis & Tilcsik: 2013) their signatures created. And none of the proposals received by the park executives had challenged the wisdom of the inherent path dependencies created by the RfP.
Looking across other data integration projects that ReD Associates has been involved in, it is clear that there’s a lack of recognition of the path dependencies created already when formulating a RfP. One explanation is, that the impetus for most data integration projects seem to stem from a desire to digitalize the company’s current data practice rather than build a new digitally based strategy. To automate and consolidate current data collection, rather than rethink the new possibilities a digitalization of data could mean. The decision about what data to include thus largely becomes a common-sensical process, where companies formulate data integration RfPs based on what data they already collect, but haven’t digitalized. Then, once data collection has been automated and consolidated, many companies hope to take advantage of this new entity they have created by asking: What else might they be able to learn from the vast amount of data? A question that anthropologists might be hired to help answer, by coming up with new questions to ask the new big data entity. However, due to the often-ignored path dependency the answer to that question is often: Not very much. Having lots of data doesn’t necessarily translate into having the right data. As a result, many companies end up with big data platforms, but without the ability to answer some of the questions most fundamental to them. This was the result for the theme park described in this case-study, as the CDP left the theme park without any means to currently measure whether they deliver a good customer experience. In recognizing the detrimental effect that path dependency based on early data decisions can have for companies’ big data projects, the authors of this case study suggest two new ways going forward.
Firstly, many companies would likely benefit from an open-ended analysis of their data needs, one that is not limited to what data is currently important for the company, before finalizing what data to include in a new data platform. This will enable companies to make an informed decision about what data sources to prioritize – i.e. a digitalization strategy. This suggested approach is illustrated in fig. 4 below:
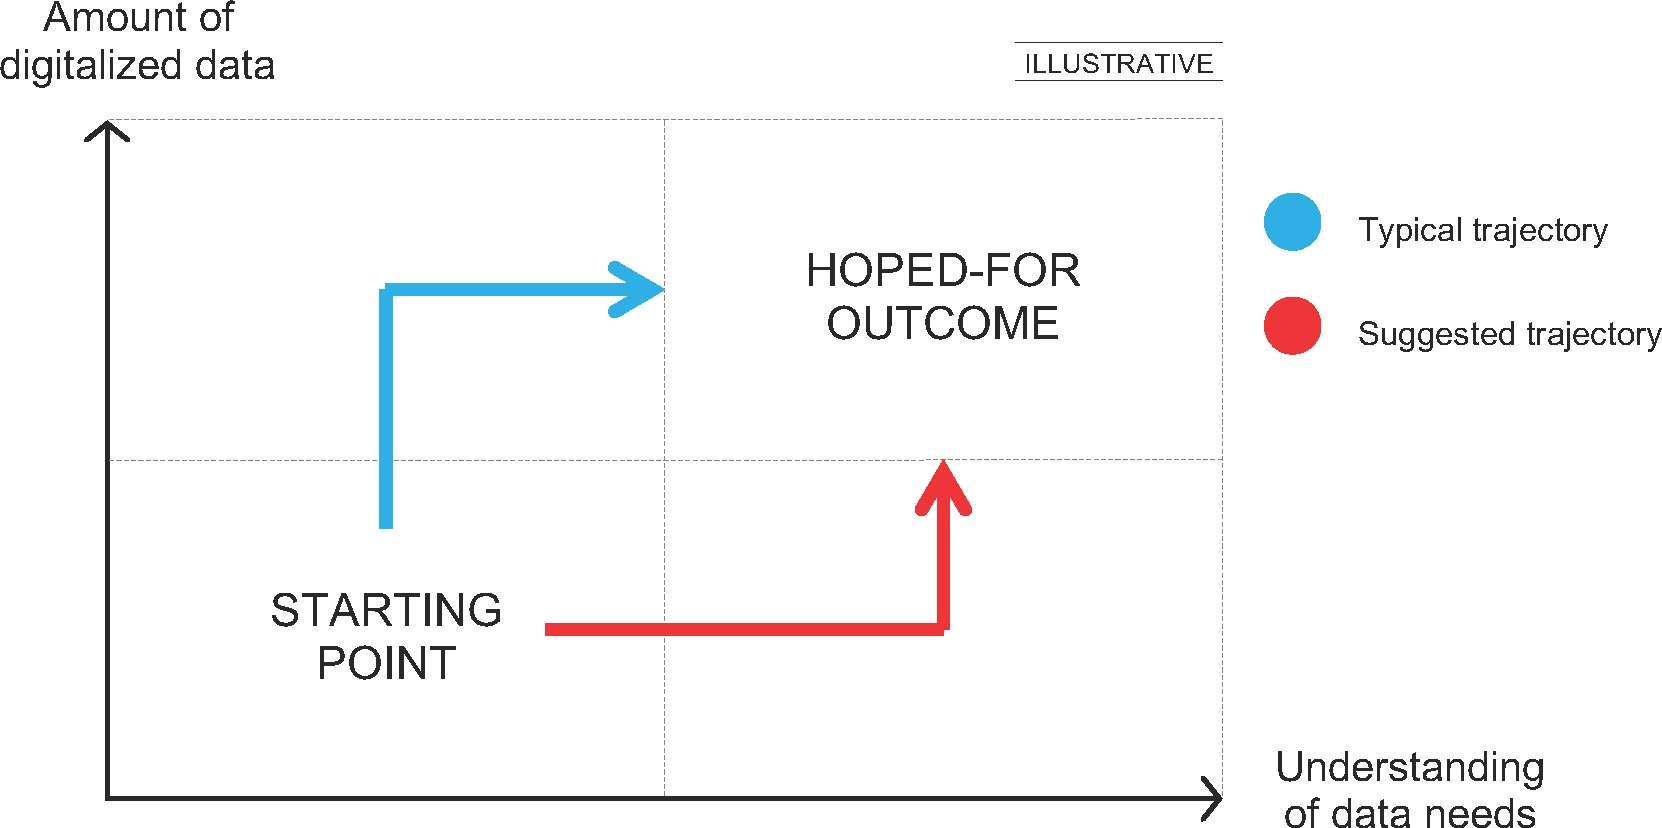
Figure 4: To build a digitalization strategy companies should first conduct an analysis of what they should use the data for (red arrow), rather than just digitalizing their current data sources (blue arrow), which is how most companies progress today.
Had the ethnographic research described in this case-study been carried out prior to the establishment of the CDP the theme park’s executives might have prioritized e.g. geo-location data over digitalizing data on the average length of stay of employees. This example illustrates how anthropologists can help companies build a digitalization strategy, by identifying what is important to measure and what data implications it entails. Prompting companies to think through their data strategy, rather than just digitalizing their current setup.
Secondly, there’s also a learning directed at anthropologists and data scientists staffed on projects with data sources clearly defined in a RfP. In hindsight, the anthropologists involved in the project described above were naïve in thinking that the CDP would be able to conjure up a measurement for whatever they found to be important for the customer experience and the data scientists were over-confident in thinking that they could. Had the anthropologists looked below the surface of the data lake early on in the project, or had the data scientists been more critical towards the possibilities with the current data sources, they would both have found that there was very little data likely to be relevant for measuring the customer experience. This could have prompted a conversation about how best to proceed, rather than chasing the mirage of trying to build a bonding index with the data available within the current CDP. A recommendation for future projects aimed at combining thick- and big data would thus be to start out with a critical assessment of the available data sources – understanding them as important actants (Latour: 1987, 1993, 2005) for the project. If these turn out to likely be incompatible with the hoped-for outcome, a re-scoping of the project will be necessary. Furthermore, even if the available data sources seem relevant it would be recommendable to try and build in the flexibility of including new ones. Had the CDP, for example, included a lot of data on individuals an early assessment of the data sources might not have raised any red flags. However, as the anthropologists’ analysis found, what mattered most for the customer experience was the intra-group bonding. Thus, despite a lack of red flags in an early assessment of the data sources due to a lot of data on individuals, the CDP might still not be able to measure the thing that mattered most for a good customer experience if it wasn’t able to capture data on groups. It would therefore be advisable for projects seeking to combine the strengths of both thick- and big data to avoid a strictly narrow scope, see fig. 5 below:
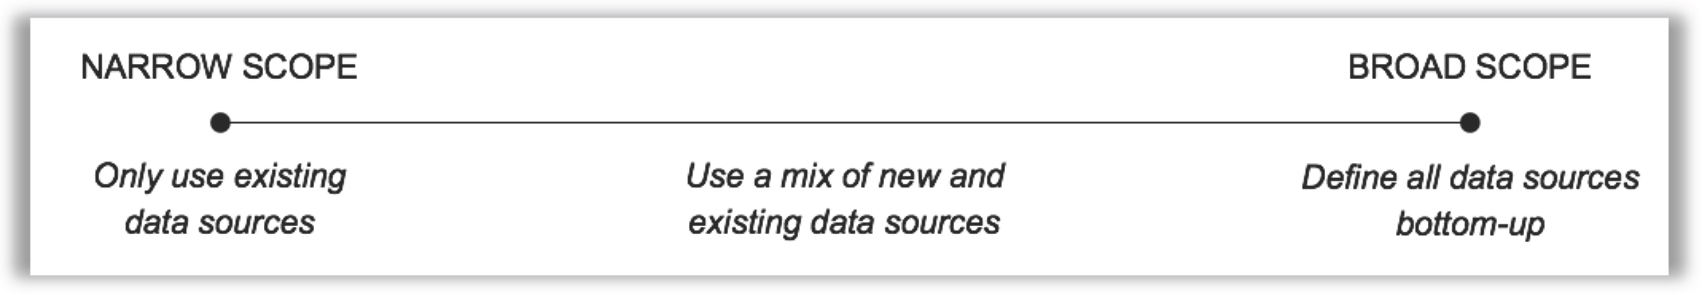
Figure 5: Projects aimed at combining the strengths of thick- and big data should avoid narrow scopes, in order to make room for the explorative power of the anthropological method.
The core strength of the anthropological method is its ability to understand people on their own terms (Malinowski: 1922), unbiased by pre-conceived ideas of what might and might not matter to them. This ability is what enables anthropologists to produce data that’s deep, meaningful and original. A narrow scope risks short-circuiting this ability, if the anthropologists’ understanding of the human experience has to take fit within a pre-confined set of metrics. Data scientists, on the other hand, often thrive in such conditions, where they can apply mathematical modelling to determine the most important factors in a defined multi-dimensional space – i.e. a dataset with a limited number of variables. However, as illustrated and argued in this case-study, the open-ended anthropological approach can have great value for data digitalization projects, by answering the question: What data should be included in a big data platform?
CONCLUSION
When companies consolidate their data in large, digital data platforms they increasingly start asking what else they might be able to do with this new asset. What other questions might it help them answer? What other truths about their company and their customers does it hold? This case-study has illustrated why many executives are likely in for a disappointment, when asking questions like these after a digital data platform has been created. Having lots of data doesn’t necessarily enable companies to answer their most fundamental questions. Especially considering that the impetus for many data integration projects is to make existing data practices faster and smarter – not to answer new questions. This case-study argues for a new approach for companies, in suggesting that they start with identifying what questions are most important for them to answer before deciding on what data to collect. This will enable the companies to be strategic about their digitalization and make informed prioritizations about what data to collect when. Anthropologists are adept at identifying the fundamental questions that companies should ask at the beginning of large data integration projects. For these reasons, companies embarking on projects entailing the collection of large amounts of data would be wise to start out with an anthropological analysis.
REFERENCES
Bauman, Zygmunt
2000. Liquid Modernity. Cambridge. Polity Press.
Brines, Julie & Serafini, Brian
2016. Is divorce seasonal? UW research shows biannual spike in divorce filings. In University of Washington News, August 21st, 2016.
CBS.
2015. Roller-coaster’s ‘weird sensations’ perceived differently with age. CBS News. Accessed July 2nd, 2018. https://www.cbc.ca/news/health/roller-coaster-s-weird-sensations-perceived-differently-with-age-1.3134223
Geertz, Clifford.
1973. The Interpretation of Cultures. New York. Basic Books.
Kuang, Cliff.
2015. Disney’s $1 Billion Bet on a Magical Wristband. Wired Magazine. Accessed July 3rd, 2018. https://www.wired.com/2015/03/disney-magicband/
Latour, Bruno.
1987. Science in action: how to follow scientists and engineer through society. Cambridge, Massachusetts: Harvard University Press.
Latour, Bruno.
1993. We have never been modern. Translated by Catherine Porter. Cambridge, Massachusetts: Harvard University Press.
Latour, Bruno.
2005. Reassembling the social: an introduction to actor-network theory. Oxford New York: Oxford University Press.
Malinowski, Bronislaw.
1922. Argonauts of the Western Pacific: An Account of Native Enterprise and Adventure in the Archipelagos of Melanesian New Guinea. Illinois. Waveland Press, Inc.
Marquis, Christopher & Tilcsik, András.
2013. Imprinting: Toward a Multilevel Theory. Academy of Management Annals: 193-243.
Stein, Brian & Morrison, Alan.
2014. The enterprise data lake: Better integration and deeper analytics. Accessed September 8th 2018. https://www.pwc.com/us/en/technology-forecast/2014/cloud-computing/assets/pdf/pwc-technology-forecast-data-lakes.pdf