
Case Study—We report on a two-year project focused on the design and development of data analytics to support the cloud services division of a global IT company. While the business press proclaims the potential for enterprise analytics to transform organizations and make them ‘smarter’ and more efficient, little has been written about the actual practices involved in turning data into ‘actionable’ insights. We describe our experiences doing data analytics within a large global enterprise and reflect on the practices of acquiring and cleansing data, developing analytic tools and choosing appropriate algorithms, aligning analytics with the demands of the work and constraints on organizational actors, and embedding new analytic tools within the enterprise. The project we report on was initiated by three researchers; a mathematician, an operations researcher, and an anthropologist well-versed in practice-based technology design, in collaboration with a cloud services go-to-market strategy team and a global cloud sales organization. The analytics were designed to aid sellers in identifying client accounts that were at risk of defecting or that offered opportunities for up-sale. Three-years of sales revenue data were used to both train and test the predictive models. A suite of analytic tools was developed, drawing upon widely available algorithms, some of which were modified for our purposes, as well as home-grown algorithms. Over the course of this project important lessons were learned, including that the confidence to act upon the results of data modeling rests on the ability to reason about the outcomes of the analytics and not solely on the accuracy or precision of the models, and that the ability to identify at-risk clients or those with up-sell opportunities by itself does not direct sellers on how to respond as information outside the models is critical to deciding on effective actions. We explore the challenges of acting on analytics in the enterprise context, with a focus on the practices of ‘real world’ data science.
INTRODUCTION
There is a pervasive view that data analytics can lead to better managed organizations and enhanced organizational performance as employees and their managers are guided to make more informed choices (Davenport, 2007, 2010; Gillon, et al. 2014). Analytics, it is argued, can assist with hiring decisions (Levenson, 2011), targeted sales (Megahed et al. 2016a, 2016b; Wixom et al., 2013), market opportunities (Chen et al., 2012), supply chain management (Gunasekaran, et al., 2017) and shop floor scheduling (Zhong et al., 2017) to name a few. However, the impact of analytics on organizations is governed by the ability to align the outcomes (i.e. predictions, optimizations) with the everyday requirements of the work, and the ability of organizational actors to make sense of the analytics and be positioned to take action informed by them (Sharma et al., 2014).
In part, what is driving enthusiasm for enterprise analytics are the increasing number of organizational processes that generate digital information about the execution of these processes. Zuboff (1985, 1988) was one of the first to recognize the potential of these new sources of information to generate insights about a company’s operations and how to improve upon them. More recently there has been renewed excitement in tapping into a company’s internal databases, both more structured, so-called systems of record, and what Moore (2011) has called systems of engagement which generate decentralized information, including interactions in real-time through mobile and social technologies. These internal company data sources are claimed to offer competitive advantages for those organizations able to mine them for insights.
Underpinning these claims are assumptions about the availability of useful data, either sourced internally or externally available. While it might seem straightforward to gain access to internal company data, this is not always the case. Data may be scattered throughout the organization in private or personal databases that in theory are available, but in practice the effort involved in centralizing the data in a single repository may be prohibitive unless a long-term payoff can be clearly and confidently defined. Even internal data that are kept in central locations can present problems for their use in situations where the way the data are ‘produced’ has varied as boundaries between organizational entities are redrawn or the work processes and policies are redefined, changing the ‘meaning’ of the data over time. For example, a product offering in the portfolio of one organization may be moved to a newly created organization’s portfolio, making it difficult to make machine learning predictions about future sales without making assumptions about the stability or transformation of the data in the new organization. Likewise, a change in policy, such as the point at which sales representatives are required to get price approval, can modify what is recorded in a sales database. Again, if the data are to be used, analysts and data scientists will be required to make assumptions about the importance of such changes and how best to account for them in their analyses.
‘Detective’ work is often needed to uncover organizational changes that must be accounted for to understand the data and to interpret the outcome of the analytics. This means that measures of analytic precision and accuracy which are often used as quality checks on the analytics, must be measured against the confidence that the data represent meaningful organizational phenomena (Hovland, 2011). In the above examples, the analytics may indicate an organizational or policy change and not a change in selling behavior or future sales opportunities.
Additionally, organizational problems must be framed as ones that the available data are well suited to address. It is not always the case that the most important questions are ones the data in hand are able to shed light upon. Opportunities to upsell may have more to do with information not readily available such as personal relationships between the seller and client or recent contacts clients have had with competing vendors. The analytics team must be realistic about what can be learned from the data available given its limitations. They must assess if the data in hand is adequate to address issues of concern or if they need to invest in acquiring additional data. This situation reminds us of the well-known adage that what can be measured is not always what is worth measuring (Muller, 2018:3). The most important issues may not be those that are addressable by the data available.
Furthermore, numbers have little organizational power unless they can be understood and trusted by organizational actors (Power, 1997)) who themselves are caught up in structures of accountability often outside their immediate control (Barley and Tolbert, 1997). Even when the results of analytics suggest particular courses of action, workers may not be in a position to take such action. For example, in an earlier study by the first author, predictive analysis showed that hiring additional people would increase the throughput of an organizational process and in the end offer financial benefit to the organization, but it was not acted upon because the power to make hiring allocations laid outside the responsibility of the process owners. As the excitement surrounding the potential of advanced analytics confronts the reality of acting upon the analytics within the enterprise, it is becoming increasingly clear that ‘explainability’ of outcomes will gate the usefulness of the analytics (Abdul et al., 2018; Miller, 2017; Ribeiro et al., 2016). Organizational actors are unlikely to act upon the analytics if they do not trust the outcomes, feel confident in the rationale behind the analytics, and understand the limitations, strengths and weakness of the analysis.
THE CASE
Our case reports on a two-year project to develop sales analytics for an internal group of global cloud IT infrastructure-as-a-service (IaaS) sellers and their managers. Cloud IT infrastructure services are a relatively new type of service that provides computing resources over the internet. Cloud services differ from traditional ‘fixed duration IT service’ contracts where modifications to a contract can only occur by agreement of the client and the provider and under circumstances clearly outlined in the contract. The new cloud service offerings primarily are sold based on a consumption model: the more the client consumes of the service the more they pay. So the amount of a service consumed, such as number of virtual servers or the amount of storage used, can go up or down depending on the client’s needs without a change in the contract. Our project aimed at developing sales analytics to provide insights into client buying and consumption behavior for these new IT infrastructure-as-a-service offerings.
The research team included a machine learning mathematician with prior experience working with the type of data used to build our predictive models, an operations researcher who had developed analytics to predict win-rates for IT infrastructure service contracts (Megahed et al., 2015), and an anthropologist with many years of experience studying organizational work practices, including the work of those who deliver IT infrastructure services. The three researchers worked with a business unit strategy team tasked with helping improve the go-to-market or selling capabilities of the cloud services organization by providing training, sales tactics, and cross-team communication support. We engaged the go-to-market strategy team and the global cloud sales leadership to ascertain the potential value of predictive sales analytics and later directly with sellers and their managers to assess the usefulness of the analytics and how our predictions could be of benefit in their daily practices.
The cloud organization was global and consisted of several business divisions, each with a different set of service offerings in its portfolio. We focused most of our efforts on two geographies, Europe and North America; and two business divisions, one selling ‘on premise’ cloud services1 and the other ‘public’ cloud services.2 During our project there were two realignments in the cloud organization which resulted in some cloud service offerings being moved from one division of the organization to another.
We used three years of ledger data that recorded revenue for the cloud services organization to develop the predictive models. These data included the name of the client, the offerings sold, the business unit credited with the sale, and the revenue realized. Our aims were to help sellers prioritize sales opportunities, reduce churn and defections, target particular cloud service offerings for expansion, and improve sales productivity overall. The sellers we worked with were members of the direct sales team who had responsibility for specific sales territories and particular clients or client types.
Our overall mission was to enable the cloud sales organization to become a leader in enterprise cloud solutions by providing them with the analytic tools to grow the cloud business, including basic reporting and advanced analytics. Our case study reports on the initial stages of the implementation of a longer-term vision (see Figure 1), where we initially focused on sales leaders responsible for specific geographic territories (geo leaders), sales managers, and sellers as our users. We developed a starter set of analytics that included risk of defection (e.g. customers likely to terminate their contract) and growth or shrinkage of client and offering revenue. Our initial data sources were ledger data and client registration data. In the longer term, we envisioned enabling others in the company to use our ‘platform’ to add new data sources, analytics, and users.
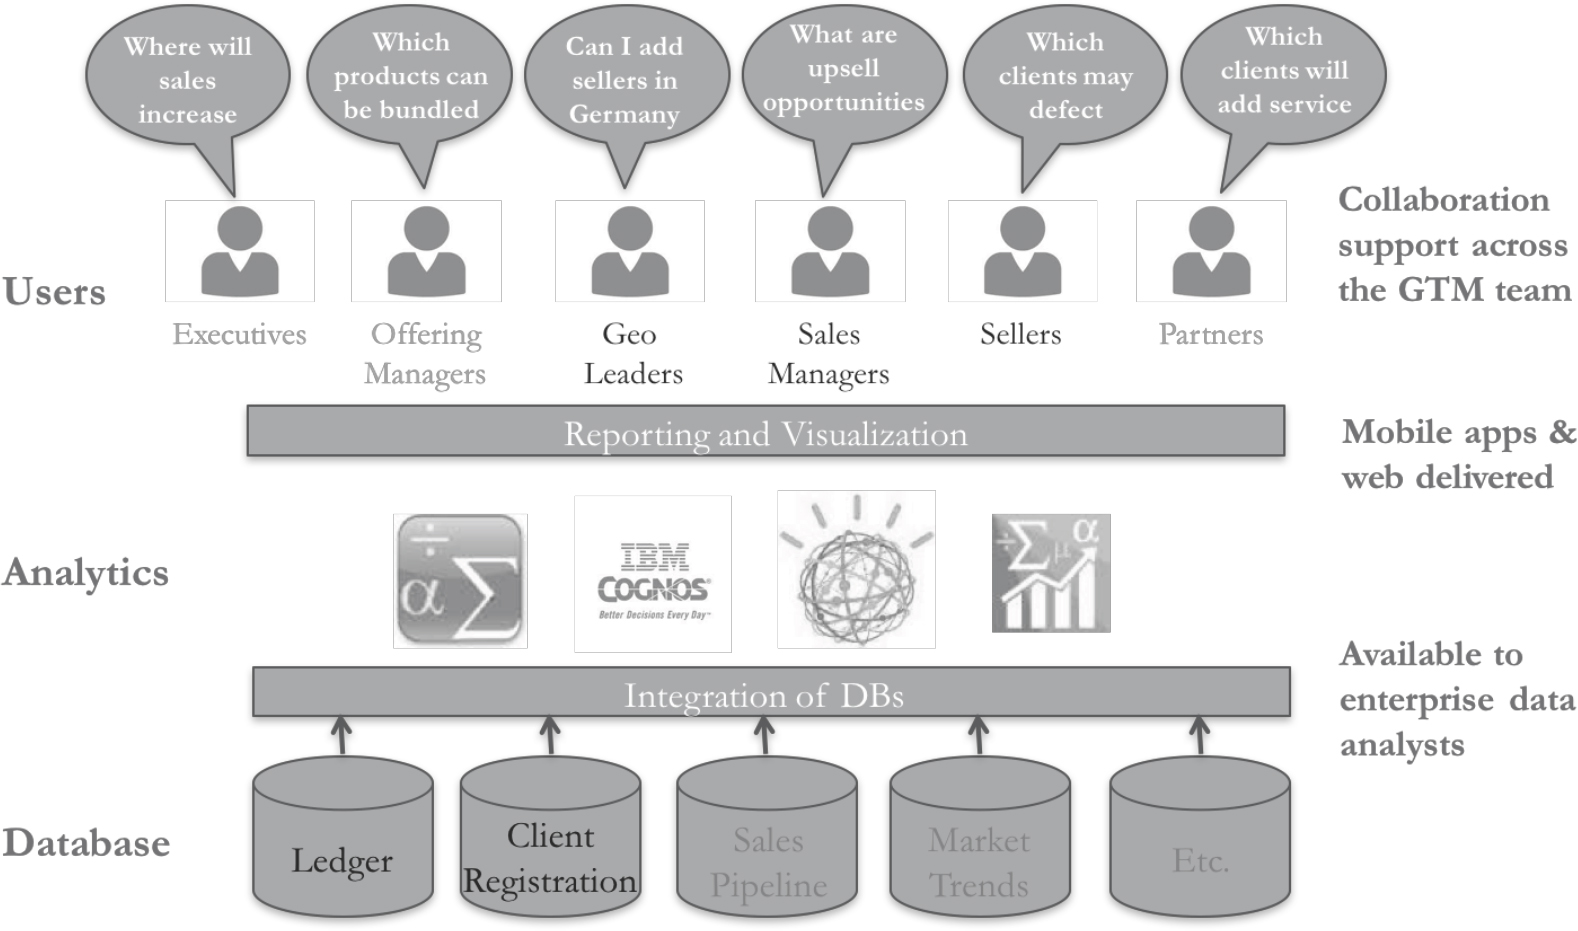
Figure 1. Cloud Sales Analytics Long Term Vision
THE PRACTICES OF DOING DATA ANALATICS
Organizations today have heightened expectations about the contribution advanced machine learning approaches can make to their performance, whether improving internal processes, more successfully connecting with clients, or planning for the future (e.g. hiring, resource allocation, expansion of operations, etc.). However, organizations are only beginning to understand what is required to ‘unlock’ the secrets of the data sequestered in internal corporate databases. We outline some of our experiences doing data analytics in the enterprise, specifically developing sales analytics for the cloud organization where we highlight practices implicated in transforming ‘data’ into insights to drive actions within the enterprise. These practices include, data sourcing and cleansing, selecting algorithmic options, troubleshooting ‘errant’ outcomes, and iterating on analytic models and output.
Data Sourcing and Cleansing
It goes without saying that one of the first tasks required to turn data into insights is gaining access to data, in our case sales ledger data and client registration data. This involved obtaining many approvals where we had to argue for the importance of our project and also demonstrate how we were going to protect the security of this highly confidential data. Once we were granted access to the data we had to identify people in the organization who understood how the ledger database was structured, for example, in tables of various kinds. We then had to write scripts to query the database and export just the data we needed for our analyses. Since these data needed to be updated monthly, we later automated this process to keep the data up-to-date as last month’s analyses, while useful, were not nearly as valuable as those that included the most recent revenue figures.
We also found that the ledger data needed to be aggregated to reduce the number of data points used in the analysis. By aggregating the revenue data by month we were able to run our computations faster, facilitating both experimentation and debugging of the algorithms, and eventually the time needed to routinely create up-to-date reports. In developing the algorithm to predict risk of defection we experimented with aggregating monthly data by calendar quarter to reduce some of the noise found in the monthly data where revenue recorded for one month might later be moved to a prior month based on new information. Previous experience with the ledger data showed that calendar quarter data was much less noisy than monthly data which was in part because at the quarter close additional actions were mandated to validate the accuracy of the entries. However, based on feedback from sellers where they expressed a desire to have monthly updates to our predictions, we experimented with a three-month moving average where, somewhat to our surprise, we found the predictive power of our algorithms was not significantly diminished. We finally settled on aggregating the data by a three-month moving average enabling us to update our predications monthly.
Another issue we had to deal with was resolving differences in how entities (clients and service offerings) were named in the data corpus. Entity recognition and resolution is a near universal problem in data analytics and we too had to decide, for example, whether to combine all client accounts at the highest recognizable corporate level. Since the ledger revenue data is based directly on billing operations, it was not surprising to find accounts assigned to billing addresses and not a single ‘corporate’ address associated with a chain of franchises of the same corporate brand. And for large, complex organizations there might be global subsidiaries of the ‘same’ company with somewhat different names. Should they be treated as unique entities or combined as a single entity? These distinctions are very hard to recognize programmatically and required data cleansing efforts that were far from trivial. We ultimately arrived at a method for addressing these naming issues knowing we could have made different choices. There was no a priori ‘right’ way to aggregate and name entities, but any choice made had consequences for our predictions, the interpretation of the results, and how best to target interventions. While more experiments likely would have enabled us to better understand the impact of our choices, we settled on a strategy of client name resolution feeling pressure to get our results to the sellers for their feedback on the usefulness of the predictions.
Algorithmic Options
Early interactions with the cloud services go-to-market strategy team led us to focus our initial analytics on predicting risk of defection, growth and shrinkage in account revenue, growth and shrinkage in service offering revenue, and cross-sale opportunities.3 Our algorithms deployed supervised machine learning approaches, where we focused on developing models (or patterns in the ledger data) to identify which client accounts4 were at risk of defection. For this analysis we used three years of revenue data aggregated by month for each client in a given country (e.g. Global Fin Company in France recorded $100K in revenue in April of 2015, $110K in May, $110K in June, etc.).
Through machine learning experimentation we discovered that a single analytic feature that we called the ‘quotient’ was a good predictor of accounts that were likely to defect in the following six-month period. The quotient uses nine months of revenue data for the prediction and outputs a short list of accounts at risk of defection. Our analysis showed that roughly half the accounts on the list would defect within six months unless action was taken. The quotient (Q) is calculated using a relatively simple formula which takes the current three months of revenue (C3) and divides it by the average revenue over the prior six months (A6) divided by two. Q = C3/(A6/2). The list of accounts at risk of defection is sorted by the geography and country, and ranked by a relative quotient score between 0% and 100%. The relative score considers likelihood of defection as output by the model (Figure 2).
Although this ‘simple’ algorithm yielded useful results, with precision metrics in the 50% range, we wanted to explore more advanced machine learning methods to see if we could improve the precision and accuracy of our predictions. For this second effort we focused on predicting the growth and shrinkage of the average revenue. We wanted to know how likely it was that revenue by client or by offering would grow or shrink by X% in the next six-month period compared to the average revenue for the current three-month period. For account predictions, revenue was aggregated for all the offerings sold to any given account in a given country. For offering predictions, revenue was aggregated for all the accounts that sold a given offering in a given country. We experimented with different baseline classifiers (Abhinav et al., n.d.) and found gradient boosting machine (GBM) classifier (Chen and Guestrin, 2016) yielded the best results for accuracy. To achieve this metric, we divided the historical labeled dataset into training and testing (80% training and 20% testing). In our case the data consisted of three years of cloud sales revenue data. The model was trained using the training data doing k-folds cross-validation, where the training dataset is divided into k folds, and the model is trained k times on k-1 fold and tested on the held-out fold. This was done to avoid over-fitting, which might result in the model being too good for the training data, but not for the new testing data. Then, a final trained model was run on the testing data to evaluate it on a number of metrics, including precision and accuracy. We experimented with multiple classifiers and chose the ones that gave the highest accuracy on the testing dataset. This model was then used for our predictions of future data points where the outcomes are not yet known. We further developed the model for precision maximization at a minimum recall and solved it using Gaussian optimization. This new model, we called GOPT, directly maximizes precision to yield more actionable results while still maintaining a high degree of accuracy (Abhinav et al., n.d.). Features of both models included revenue for the past nine months (3 quarters), country of the client, business division, and several constructed features not recorded directly in the ledger data (Figure 3).
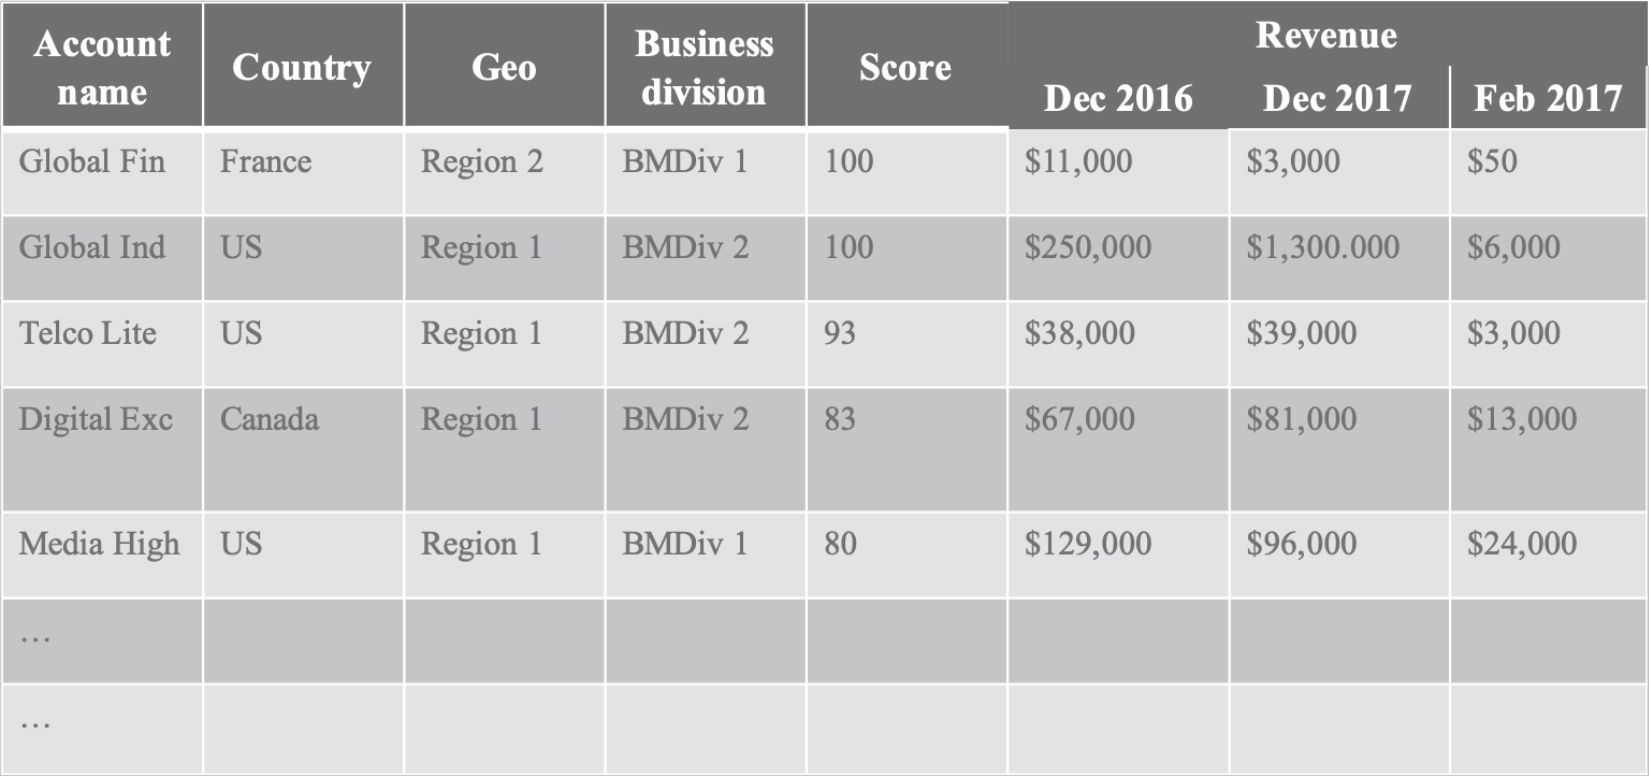
Figure 2. Risk of Defection Report
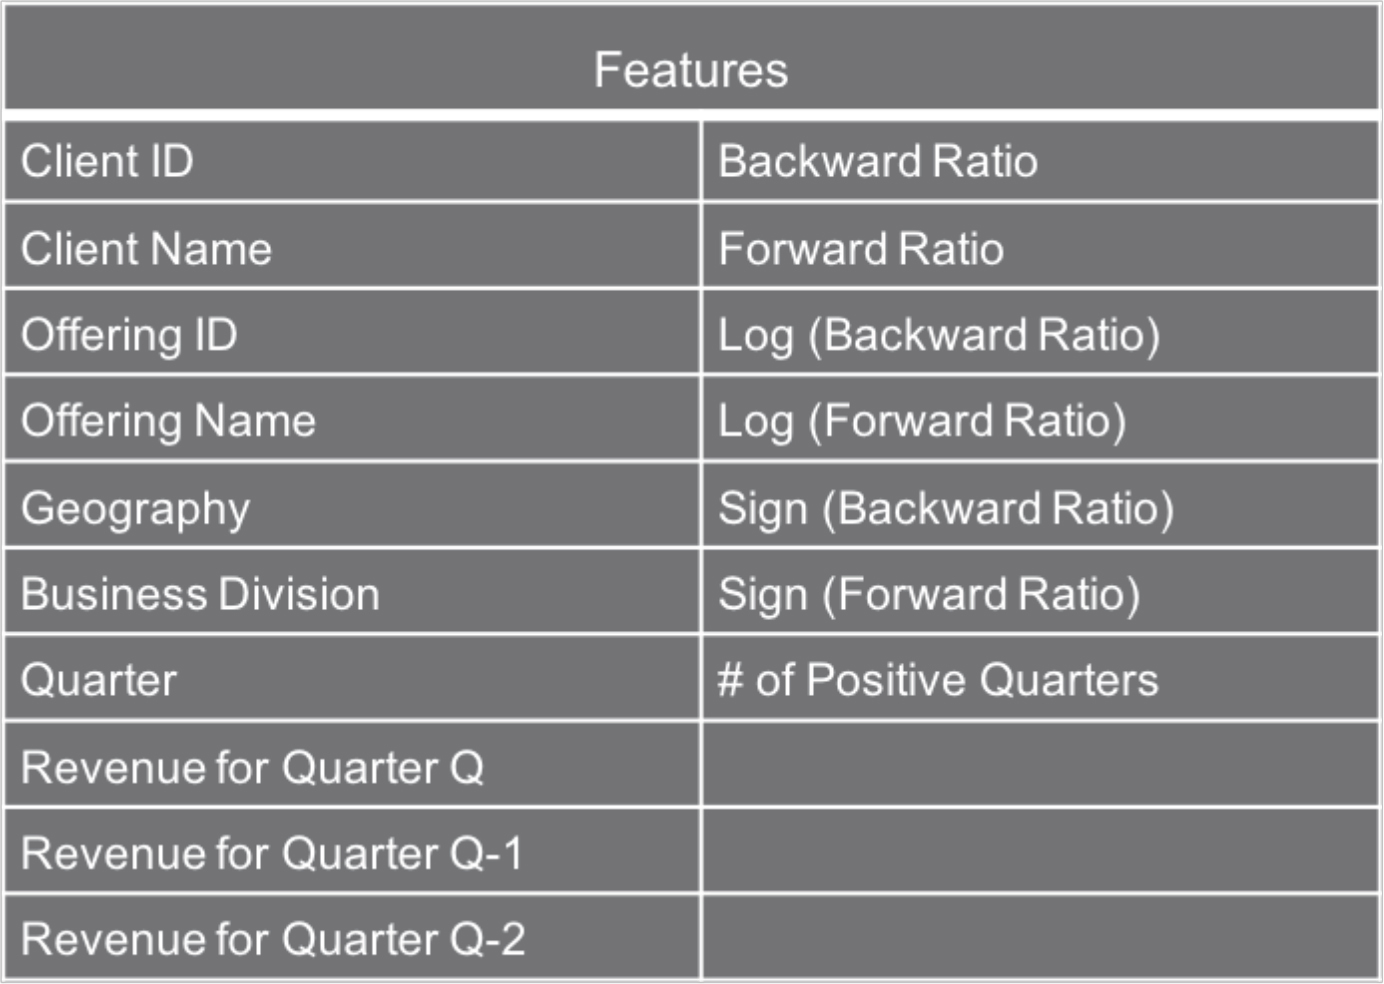
Figure 3. Features Used for Growth and Shrinkage Predictions
The output of the model was a list of accounts (and offerings) that were predicted to grow or shrink in the next six-month period by X% over revenue for the last three months. The percentage of growth or shrinkage could be set to between 0% (defection) and 100% (double revenue). For our initial reports we set the percentage to 50% growth or shrinkage. The results were sorted by geography and country and ranked by a relative score between 0% and 100% which considered the likelihood of growth or shrinkage as output by the model and the average revenue for the last three months (Figures 4 and 5). We chose to include in our ranking the average revenue for the last three months to prioritize (higher on the list) those accounts or offerings with the most potential revenue gain or loss in absolute dollars.
The values for precision and accuracy differed depending on which growth or shrinkage percentages were used, however, these figures were consistently higher than for the simpler risk of defection quotient model. When our model was tuned to maximize precision over accuracy, the precision of the growth and shrinkage models was over 90% while holding accuracy to over 80% (Abhinav et al., n.d.).
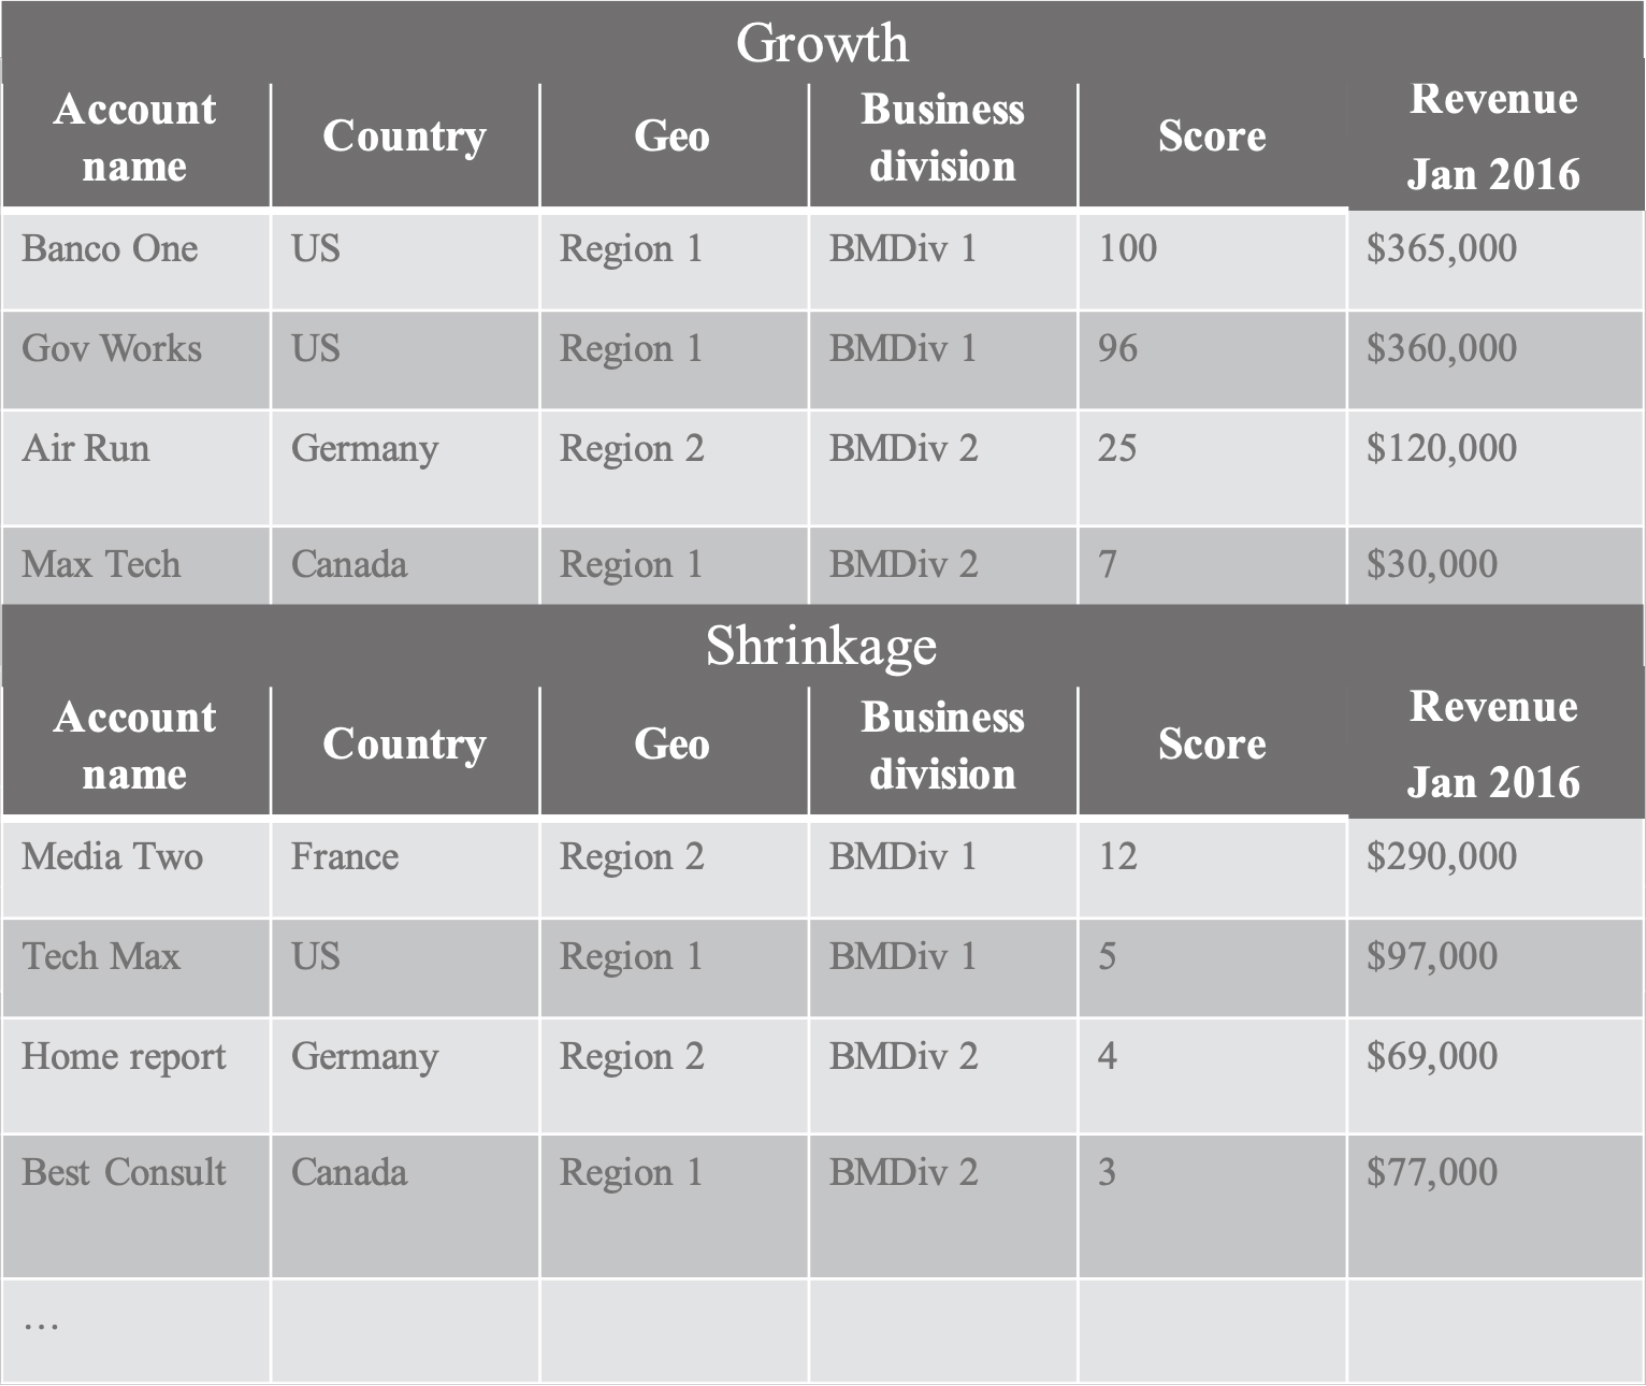
Figure 4. Accounts Predicted to Grow/Shrink by 50% Report
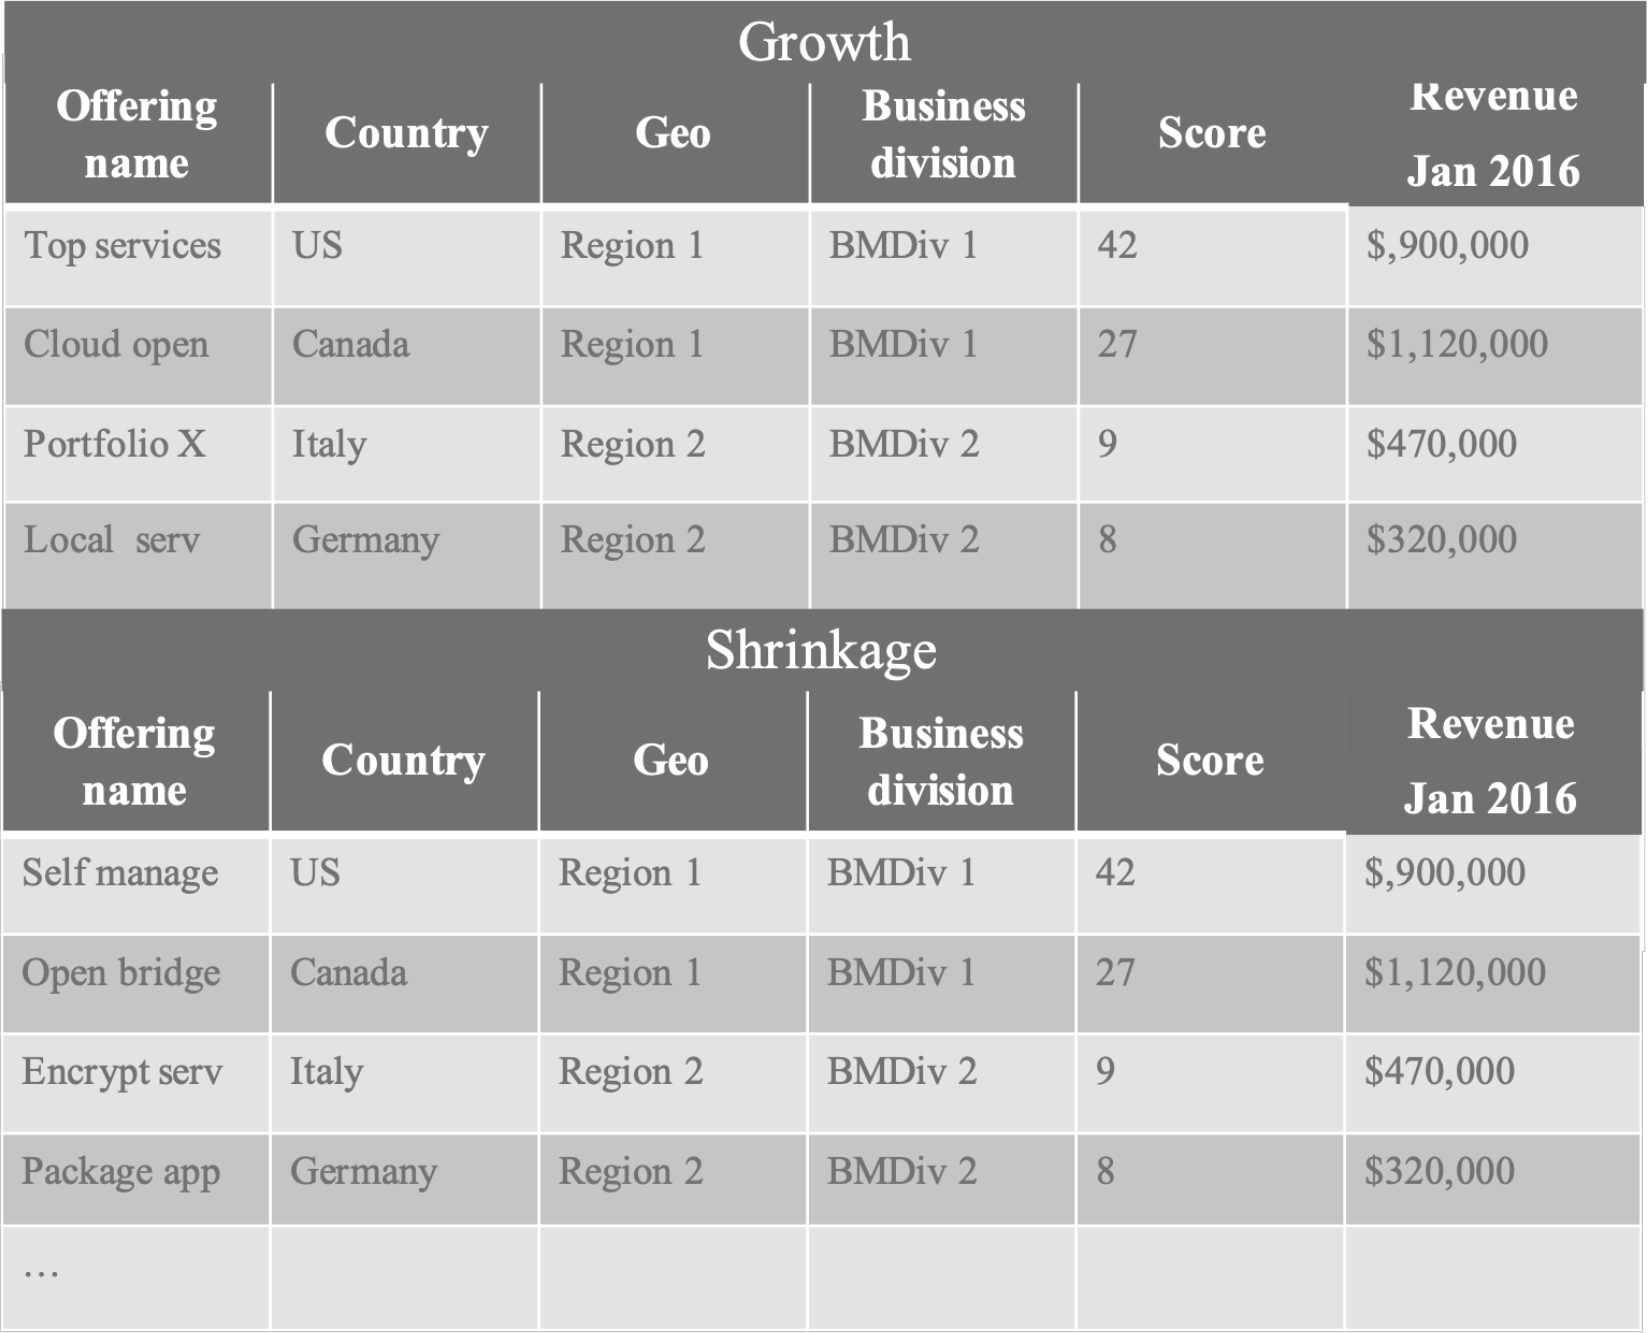
Figure 5. Offerings Predicted to Grow/Shrink by 50% Report
Troubleshooting Errant Outcomes
Our interactions with sellers and sales managers was critical to our ability to debug our analyses, make course corrections in our methods and algorithms, and understand how our predictions could be useful in their everyday work. But before we shared the results with sellers, as their time was limited and we did not want to introduce any unnecessary concerns about the accuracy of our analytics, we first reviewed the output of our models to spot errors. Some errors were relatively easy to identify even by someone without domain knowledge. For example, we found an error in the early growth and shrinkage predictions where the same client was on both the list of accounts whose revenue was predicted to grow by 50% and also shrink by 50%. Once pointed out, a ‘bug’ in the code was quickly found and corrected. While this error was relatively easy for us to identify, it raised questions about the possibility that ‘bugs’ with a subtler impact on the predictions might go undetected. Since there is no ‘ground truth’ regarding which client accounts will grow or shrink, we had to rely on sellers and other users to identify problems with the data, the cleansing processes, the code that implemented the model, and even the measurements (e.g. accuracy and precision) that expressed confidence in the predications.
Errors only detectable by someone familiar with the domain of global IT cloud services and specific client or service offering required our ongoing interactions with sellers and sales managers. For example, in a couple rare cases completely distinct customers were confused in our cleansed data. Our method for resolving entity names created erroneous combinations of unrelated customers. These glitches were identified by the sellers who knew the clients better than we did and recognized that a client appearing on our defection list had no reason to be there.
In a somewhat different example, a sales executive pointed out to us that some offerings (e.g. professional services) were by design fixed duration contracts, even though they were sold by the cloud organization, and we should expect the revenue for these offerings to end without suggesting there might be a problem with the account. We queried the sellers to find out what offerings should be excluded from our analysis. While we always applauded the sellers when they pointed out anomalous results, we also knew this was a double-edged sword, as too many such errors could ultimately undermine their confidence in our analysis.
Iterating on Analytic Models and Output
Beyond their role in helping us detect errors and anomalies in the analytics, the sellers also made suggestions about how our analysis could be more useful to them. As discussed above the analytics were based on aggregating monthly revenue by quarter to smooth out fluctuations in the monthly revenue that detracted from our predictions. However, the sellers’ temporal rhythms (how often they contacted clients, checked on the account status, were held accountable by their management) made it more useful to see changes in the predictions on a monthly basis. Because quarterly reports were not as valuable to them we re-wrote the code to aggregate the monthly data based on a rolling three-month period so each month new results were available while leaving in place the benefits to the accuracy of our predictions derived from the use of a three-month aggregation of the revenue data.
LESSONS LEARNED
Our experiences developing analytics for cloud services sellers taught us several important lessons. First, measures of analytic accuracy and precision, by themselves, do not govern the usefulness of the analytics. Second, the ability to predict outcomes with a high degree of confidence does not necessary suggest what actions should be taken in response.
Trading Precision and Accuracy for Interpretability
The first lesson is best demonstrated by comparing the reception received by our two different analytic models – risk of defection and growth/shrinkage prediction. The risk of defection model followed an easily communicated formula that produced the ‘predictions’ about which client accounts were likely to defect in the next six months. The sellers could inspect the monthly ledger data and posit a reason certain accounts were on the risk of defection list. While they would see fluctuations in the revenue numbers (there was not always a linear decline in revenue from month-to-month), they surmised that this pattern of fluctuating revenue was found in the historical data of those accounts that later defected. They could assess the reasonableness of the outcomes. This allowed a certain level in trust that the analytics were identifying client accounts with a greater likelihood to defect and as such, they should pay attention to these accounts.
What proved to be challenging for some sellers was to understand what was meant by the statement that accounts on the list had a 50% chance of defecting in the next six months. At first glance for some it seemed like a coin toss to say 50% of the accounts on the list would defect and 50% would not. But this list represented only a small fraction of all the accounts in the database and for the entire set of accounts the percentage that would actually defect was quite small. This example points to the importance of considering the denominator in interpreting the meaning of percentages (Guyer, 2014). Our report significantly narrowed the number of accounts that the sellers were advised to investigate why they appeared on the list, and for some, intervene to change the predicted outcome.
Contrasting the relatively simple risk of defection analytics with the growth and shrinkage analytics that used sophisticated machine learning algorithms, we found it more difficult for users to ‘intuitively’ reason about why some accounts or some offerings were on the list of those predicted to grow or shrink by 50%. The growth and shrinkage model took into account multiple features, producing highly accurate and precise predictions. However, the results of these models were difficult to reason about as some of the features were abstract and not easily mapped on to the sellers’ everyday experiences (see Figure 3) and the math behind the algorithms was complex. Inspection of the revenue data could be confusing as it was difficult to see the direct link between the revenue data and the predictions, and impossible to explain in everyday language exactly how the model arrived at the predictions. In our reports to sellers we opted to show only the last month’s revenue, because we feared showing more historical data would run the risk of confusing the sellers. The analytics found patterns in the data that humans could not ‘see’ requiring a level of ‘blind’ trust on the part of the sellers.
Our growth and shrinkage model had a variable that could be tuned, namely a percentage (between 0% and 100%) by which the client account or offering revenue would grow or shrink. We experimented with setting the percentages at different values and debated about such things as whether it would be more useful to set growth percentages higher or lower than shrinkage percentages. Originally, we planned to let the sellers set the percentage, but we soon realized this likely would introduce more confusion and realistically we knew the sellers had little time or expertise to experiment (even with our help) with how best to set this variable. The potential confusion stemmed, in part, from the fact that accounts could show up on the list as predicted to grow by 30%, but not the list predicted to grow by 20%. While we understood why this was possible as each prediction was discrete, we were concerned this would be difficult to explain to the sellers and this might lead them to distrust the results. From the model’s point of view these results were explicable, but it was counter intuitive from the sellers’ perspective, as they reasoned if an account is predicted to grow by 30% surely it also would be predicted to grow by 20%. In the end, we set the percentages for both growth and shrinkage at 50% with the view that over time we would tweak these percentages to be most useful to sellers as they began to trust the predictions and have a better understanding of what it meant for an account or offering to be on the growth or shrinkage list.
Due to a change of leadership in the cloud services organization and a reprioritization of resources our project ended before the sellers had a chance to fully engage with the growth and shrinkage predictions. However, our hope was that once the sellers ‘experienced’ the accuracy of our predictions and their value to them, it would be less important that they were able to reason about the patterns identified by the model. That said, in the initial stages of deployment, we believed it would be important that the models were ‘explainable’ in a language the sellers understood. This would be an important first step in allowing enough confidence in the results to act upon them.
Prediction is not Prescription: Differences Between Knowing and Acting
The second lesson we learned arose when sellers were faced with deciding what action should be taken when a client account was predicted to be at risk of defection in the next six month period. Even for the risk of defection model where sellers could reason about why an account was on the defection list, the model did not say why revenue was fluctuating in a pattern that predicted defection. As Lycett (2013) makes clear analytic tools can find patterns in the data, but without understanding the reasons for the patterns it is difficult to know what should be done to improve the situation. There were potentially many factors outside the model that were influencing a possible defection. Had there been a reorganization at the client company? Had the client started to use a competitor’s services? Was there a recent major service outage? In addition, knowing what courses of action would best address the client situation were not informed by the model. For example, the client’s organizational context or business climate, new or improved offerings in the vendor’s portfolio of services, resources available to offer incentives to the client, and so on. The analytics pointed sellers to at risk clients, but they did not tell them what action to take.
In addition, sellers did not always understand why an account was no longer on the list for risk of defection. What actions had been taken, if any, to turn the account around? In an email exchange a sales executive expressed uncertainty about how to interpret changes in what accounts were on the defection list from one month to the next, asking “Does this mean that the X accounts from the old list which don’t show up again, did ‘heal’ themselves (either as it was planned variation in consumption or the account team managed to get it up again without defection analysis trigger) or the contract did end?” The analytics gave no insight into what might have occurred to result in an account no longer being at risk of defection. Not only did this sales executive want to understand what might have cause a change in a client’s risk profile, we too wanted to know what actions sellers might have taken and the impact of their actions had on changes in revenue. We explicitly tried to get this kind of information from the sellers, asking them about steps they had taken to address the risk of defection concern or other changes in the account status that might account for the improvement. Accompanying our risk of defection reports, we included questions to help us tune our model and in the future to provide recommendations about useful steps sellers might take to correct the situation (Figure 6).
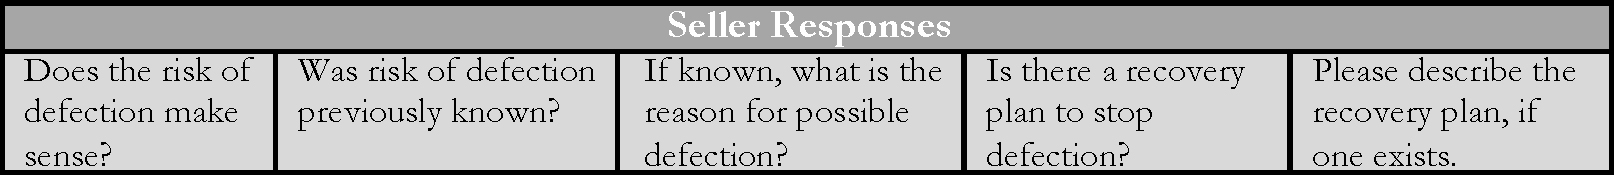
Figure 6. Questions to Sellers about Accounts on the Risk of Defection List
Regrettably, because there were no existing work practices that included recording such information, we received few responses back from sellers. Our hope was that if we could get this kind of information from sellers, overtime we would be able to improve our model and provide recommendations for successful strategies to turn around accounts.
ORGANIZATIONAL REALITIES
Organizational realities, outside the purview of analytic models, constrain the influence of analytic outcomes on actions taken by organizational actors. There is a myriad of factors that influence particular courses of action and at times these can run counter to the recommendations of the analytics. We confronted a number of these, including differing stakeholder priorities and organizational changes that had an effect on both funding for our project and the meaning of the historical data.
The Politics and Dynamics of Enterprise Analytics
As mentioned earlier one of our first tasks was securing access to cloud sales data. Extra safeguards were needed when using sales revenue data, requiring secure servers with tightly controlled access to them. There were also issues regarding who was allowed to see client data beyond the revenue figures. Non-disclosure agreements were in place for some clients restricting who was allowed to know about their relationship with the IT service vendor, what services had been purchased, or even that they had a contract at all. Fortunately for us, it usually did not include sellers from the vendor organization. Nonetheless we had to be careful about how we made our risk of defection and growth and shrinkage reports available, limiting access so that only those who had permission to see the information got access to it. As we got closer to making our reports routinely and more widely available, this issue became ever more pressing, with more scrutiny from within the company.
In addition, there were internal stakeholders (not necessarily the sellers) who had reasons to restrict how widely known it was that certain accounts or certain geographic regions risked, for example, declining revenue or opportunities for growth in particular services. Our predictions could potentially have an impact on career opportunities, how marketing dollars were spent, prompt additional oversight on sellers’ activities, and so on. We could not know in advance or control all potential unintended consequences of our analytics, but if past experience was a guide, we knew we would likely hear from those who had concerns. In these cases, our ability to move forward on routinely producing reports would require weighing the benefits of doing so against possible risks. And if the risks were to powerful organizational actors, the evidence for the benefit would have to be very strong.
Organizational Change
During the course of our project there were significant organizational changes occurring in the cloud organization, including the departure of our initial executive sponsor. While we welcomed visibility for our project as it increased the likelihood of continued funding, we also had concerns that this visibility might put us in the cross-hairs of accountability for the performance of this business unit. At one point our executive sponsor measured the investment being made in our project against future cloud sales. From previous projects we understood how difficult it would be to show that the outcome of our analytics led directly to actions that reduced churn or increased sales. But if performance pressures mounted, we would need to be able to do so.
In a somewhat different way, changes to the cloud organization had effects on the meaning of our analytics. The cloud organization was ‘carved out’ of existing groups and the boundaries between the legacy groups and the new cloud organization was unstable. This meant that offerings were moving between organizations as was the responsibility and mandate to sell them. In this email (Figure 7) from our team, we inquired about one of these changes.
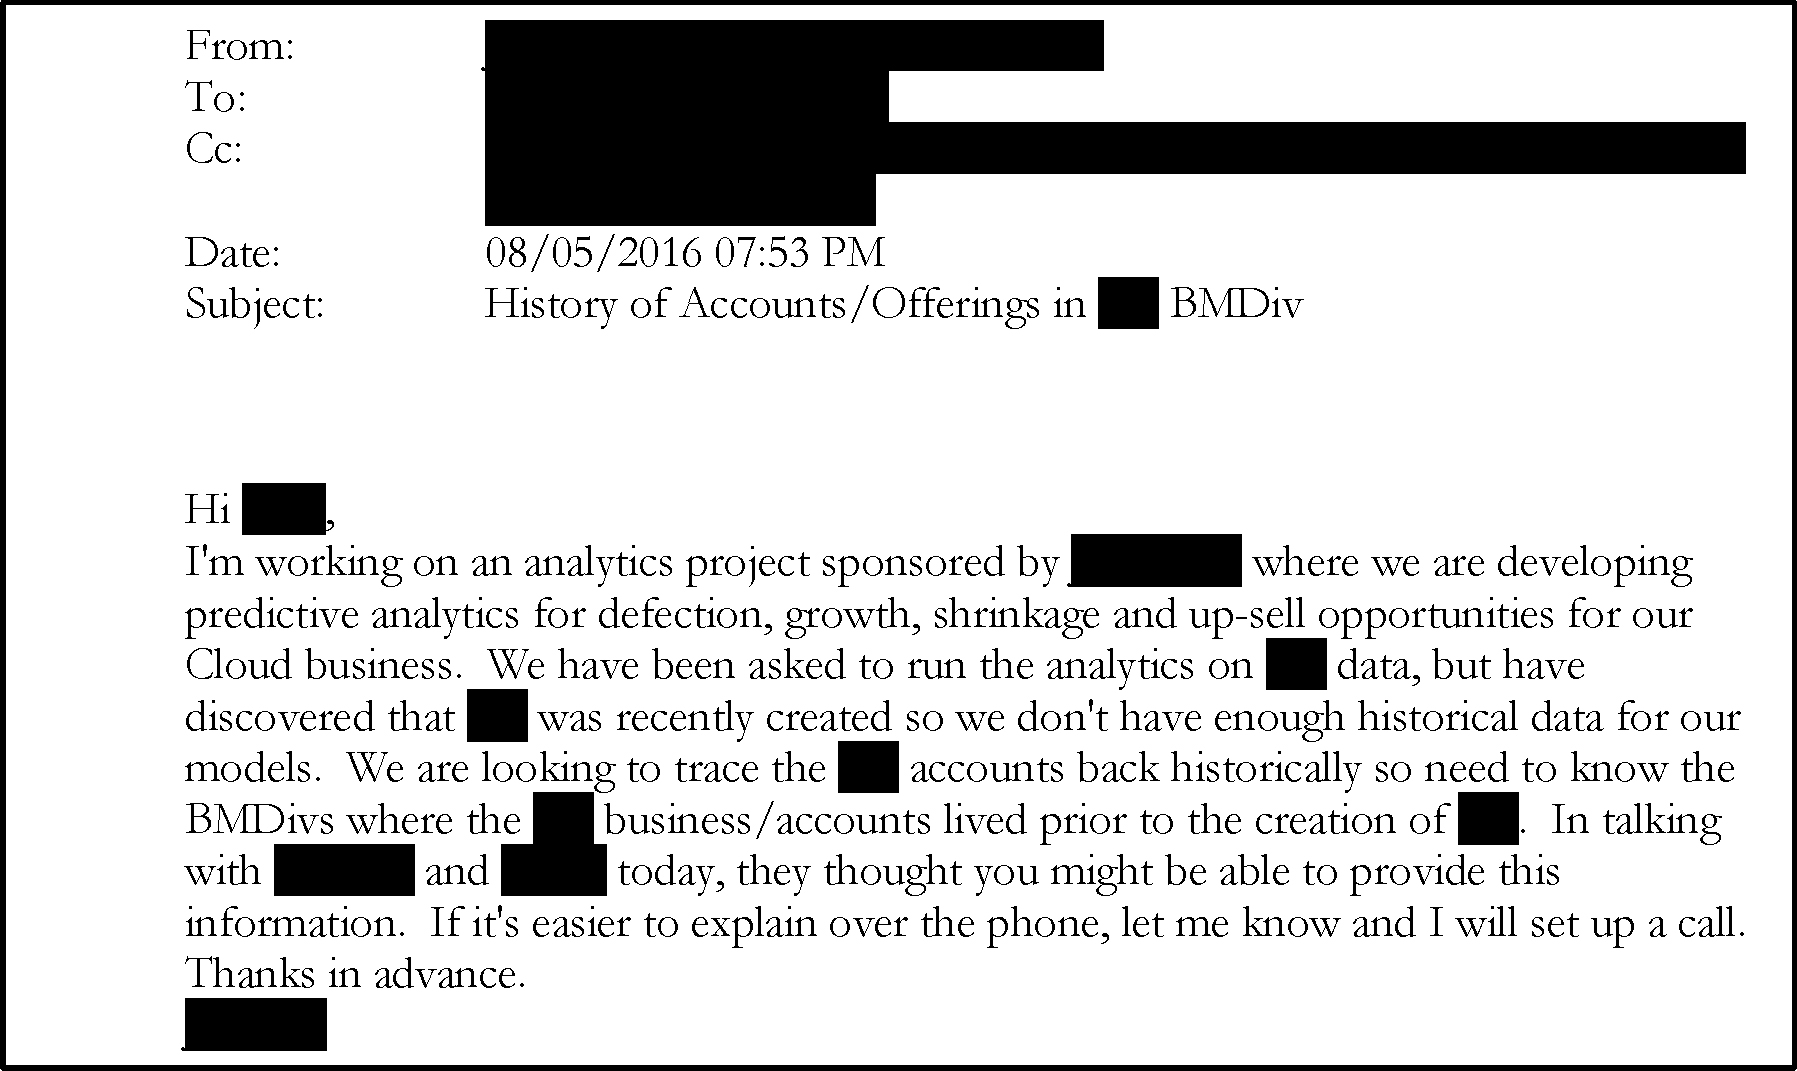
Figure 7. Email Query Regarding Business Division Alignment
These recent changes (creation of a new business unit) had an impact on where revenue was realized for particular offerings and for the relation between named client entities in the two different business groups. While we tried our best, realistically we could not keep up with all the organizational changes that were occurring and likely would occur in the future. Instead we had to ‘assume’ that these changes were not significant enough to undermine our analyses, taking some comfort in the continuing precision and accuracy of our analytics. However, this suggests that data scientists will have to stay connected to their analytics so they can make adjustments to data cleansing strategies, entity resolution schemes, and algorithmic choices that are responsive to organizational change.
GOING FORWARD
This case study should not be read only as a recounting of the challenges of enterprise analytics, but as a call for reflexivity among all those who participate in transforming data into organizational insights and action. At each step along the way from data curation to intervention there are choices that must be made, accountabilities that must be acknowledged, and consequences that must be considered. While we do not offer a set of ‘best practices’ for doing data analytics as each project will have its own exigencies, proficiencies, constraints, and timeframes; awareness of and reflection on the particular choices in play will contextualize results and make them more likely to deliver the desired impact.
Our project ended for a number of reasons before we were able to assess the full value of the analytics. Organizational changes meant that we had to (re)socialize our work and its value and convince our new stakeholders that it was feasible for our analytics to keep up with future organizational changes that inevitably would come. In addition, to ensure the analytics were responsive to these organizational changes there would need to be people inside the cloud organization with the expertise to carry on when the research team moved on to other projects. In the end, the calculation was made that these potential challenges outweighed the immediate and short term benefits of the analytics.
That said, those involved in this project, including the research team, learned a great deal about what it takes to deliver actionable analytics for the enterprise. Data analytics are often portrayed as offering ready-to-hand solutions for those with data and the expertise to put it to work. But our recent experience has humbled us and exposed us to a myriad of challenges, even obstacles, that must be navigated to realize the potential of enterprise analytics.
First and foremost, it will be necessary to design and align enterprise analytics with organizational ‘sense making’ (Hoy, 2018; Madsbjerg, 2017; McNamara, 2015; Weick, 1995) and employees’ sphere of action. In this regard we also must consider, following Hovland (2011:33), that “organizational structures […] infuse […] numbers with power.” The authority of numbers, in part, comes from establishing relationships among socio-material entities and as Power (1997) advises ‘rituals of verification’ that imbue analytic outcomes with their force.
It is also critical to recognize that enterprise analytics and measurement systems more generally (Muller, 2018; Strathern, 2000) are not neutral – they have real consequences for the lives of organizational actors. Furthermore, as Tallon et al. (2013) caution more appreciation is needed for how the increasing utilization of enterprise analytics will affect internal governance structures and accountabilities within organizations.
Finally, we must temper hype with organizational realities. As in our case, even for a company that develops and sells analytic systems and services, there are challenges to adopting them internally. Realizing the full potential of data analytics requires awareness of the technical and organizational complexity of acting on analytics in the enterprise.
Jeanette Blomberg is Distinguished Research Staff Member at the IBM Almaden Research Center in San Jose, California. Known for her research on ethnography in design processes, she currently is focused on organizational analytics where she considers linkages between human action, digital data production, data analytics, and business or societal outcomes.
Aly Megahed is a research staff member at IBM’s Almaden Research Center in San Jose, CA. With a background/expertise in operations research and analytics, his current research interests span over building analytical tools for complex service engagements, cloud computing, and IoT, and advancing research in AI and operations research.
Ray Strong is IBM researcher emeritus. He is trained as a mathematician with a PhD in mathematics from the University of Washington. His research interests include machine learning and AI, most recently applied to the domains of IT services and energy management.
NOTES
Acknowledgments: We wish to thank our sponsors, collaborators, and the cloud service sellers who went on this journey with us.
1. ‘On premise’ cloud services are hosted within the client organization’s own data center, utilizing the organizations hardware and software rather than a remote facility such as a server farm.
2. ‘Public’ cloud services use a standard cloud computing model defined by the service provider or vendor and available to the public over the internet.
3. In the end, we decided not to pursue ‘cross sale’ analytics due to time and resource constraints.
4. We use the term client, account, and client account interchangeably to denote specific clients, with each client having an associated portfolio of specific service offerings currently being received from the vendor.
REFERENCES CITED
Abdul, A., J. Vermeulen, D. Wang, B. Y. Lim, and M. Kankanhalli.
2018 Trends and trajectories for explainable, accountable and intelligible systems: An hci research agenda. In Proceedings of the 2018 CHI Conference on Human Factors in Computing Systems ACM.
Abhinav, M., A. Megahed, R. Strong, J. Blomberg and A. Elwany
n.d. Optimizing Predictive Precision for Actionable Forecasting of Revenue Change from Clients Receiving Periodic Services. European Journal of Operational Research.
Anderson, K., D. Nafus, T. Rattenbury and R. Aipperspach
2009. Numbers Have Qualities Too: Experiences with Ethno-Mining. Ethnographic Praxis in Industry Conference Proceedings 2009, pp. 123–140.
Barley, S. R., & P. S. Tolbert
1997 Institutionalization and structuration: Studying the links between action and institution. Organization studies, 18(1), 93-117.
Blomberg, J.
2008 Negotiating Meaning of Shared Information in Service System Encounters. European Management Journal 23:213-222.
boyd, d., and K. Crawford
2012 Critical questions for big data: Provocations for a cultural, technological, and scholarly phenomenon. Information, communication & society 15.5: 662-679.
Cefkin, M., J. Owensby and J. Bomberg
2007 The implications of enterprise-wide pipeline management tools for organizational relations and exchanges. Proceeding of Group, Sanibel Island, FL, US, ACM.
Chen, H., R. H. Chiang and V. C. Storey
2012 Business intelligence and analytics: from big data to big impact. MIS Quarterly 1165-1188.
Davenport, T. H. and J. H. Harris
2007 Competing on Analytics: The New Science of Winning. Harvard Business School Press, Boston, MA.
Davenport, T. H., J. H. Harrisand R. Morison
2010 Analytics at Work: Smarter Decisions, Better Results. Harvard Business Press, Boston, MA.
Elish, M. C. and d. boyd
2018 Situating methods in the magic of Big Data and AI. Communication Monographs, VOL. 85, NO. 1, 57–80. https://doi.org/10.1080/03637751.2017.1375130
Fiore-Silfvast, B. and G. Neff
2013 What We Talk about When We Talk Data: Valences and the Social Performance of Multiple Metrics in Digital Health, EPIC 2013 Proceedings, pp. 48-62, American Anthropological Association.
Gillon, K., S. Aral, C-Y. Lin, S. Mithas and M. Zozulia
2014 Business analytics: radical shift or incremental change? Communications of the Association for Information Systems 34(13), 287–296.
Gunasekaran, A., et al.
2017 Big data and predictive analytics for supply chain and organizational performance. Journal of Business Research 70: 308-317.
Guyer, J. I.
2014 Percentages and perchance: archaic forms in the twenty-first century. Distinktion: Scandianvian Journal of Social Theory 15:2, 155-173.
Hovland, J.
2011 Numbers: Their Relation to Power and Organization. In The Mutual Construction of Statistics and Society. Saetnan, A. R., Lomell, H. M. and Hammer, S. (eds.), Routledge, NY.
Hoy, T.
2018 Book Review: The Paradox of Sensemaking, EPIC Perspectives. https://www.epicpeople.org/book-review-paradox-of-sensemaking/
Levenson, A.
2011 Using targeted analytics to improve talent decisions. People and Strategy, 34(2), 34.
Lycett, M
2013) ‘Datafication’: making sense of (Big) data in a complex world. European Journal of Information Systems 22(4), 381–386.
Madsbjerg, C.
2017 Sensemaking: The Power of Humanities in the Age of the Algorithm. Hachette Books, UK.
McNamara, L.
2015 Sensemaking in Organizations: Reflections on Karl Weick and Social Theory. EPIC Perspectives. https://www.epicpeople.org/sensemaking-in-organizations/
Megahed, A., Ren, G.-J., and Firth, M.
2015 Modeling business insights into predictive analytics for the outcome of IT service contracts. In Services Computing (SCC), 2015 IEEE International Conference, 515-521.
Megahed, A., Yin, P., and Motahari Nezhad, H. R.
2016 An optimization approach to services sales forecasting in a multi-staged sales pipeline. In Services Computing (SCC), 2016 IEEE International Conference, 713-719.
Megahed, A., Gajananan, K., Asthana, S., Becker, V., Smith, M., and Nakamura, T.
2016 Top-Down pricing of IT services deals with recommendation for missing values of historical and market data. In International Conference on Service-Oriented Computing, 745-760.
Miller, T.
2017 Explanation in artificial intelligence: insights from the social sciences. arXiv preprint arXiv:1706.07269.
Muller, J. Z.
2018 Tyranny of Metrics. Princeton University Press. Princeton, NJ.
Moore, G.
2011 Systems of Engagement and the Future of Enterprise IT: A Sea Change in Enterprise IT. AIIM Whitepaper.
Power, M.
1997 The Audit Society: Rituals of Verification. Oxford, UK: Oxford University Press.
Ribeiro, M. T., S. Singh, and C. Guestrin,
2016 Why Should I Trust You?: Explaining the Predictions of Any Classifier, in: Proceedings of the 22nd ACM SIGKDD International Conference on Knowledge Discovery and Data Mining, ACM, 1135–1144, 2016.
Sharma, R., S. Mithas, and A. Kankanhalli
2014 Transforming decision-making processes: a research agenda for understanding the impact of business analytics on organisations. European Journal of Information Systems 23.4: 433-441.
Strathern, M.
2000 Audit Culture: Anthropological Studies in Accountability. Ethics and the Academy, London: Routledge.
Tallon, P. P., R. V. Ramirez and J. E. Short
2013) The information artifact in IT governance: toward a theory of information governance. Journal of Management Information Systems 30(3), 141–177.
Weick, K. E.
1995 Sensemaking in organizations. Vol. 3. Sage.
Weick, K. E., K. M. Sutcliffe, and D. Obstfeld
2005 Organizing and the process of sensemaking. Organization science 16.4: 409-421.
Zhong, R. Y., C. Xu, C. Chen and G.Q. Huang
2017 Big data analytics for physical internet-based intelligent manufacturing shop floors. International journal of production research, 55(9), 2610-2621.
Zuboff, S.
1985 Automate/informate: The two faces of intelligent technology. Organizational dynamics 14(2), 5-18.
Zuboff S.
1988 In the Age of the Smart Machine: The Future of Work and Power. Basic Books, New York.